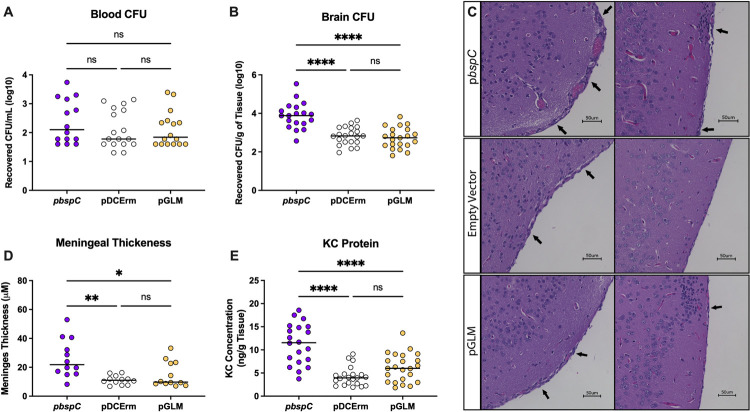
Fig 4. Flexibility of the Pocket-Guarding Gating Loop is Required for GBS Meningitis.
Mice were infected with ~4x10⁸ CFU of COH1ΔbspC GBS containing pDCErmbspC (pbspC), the empty vector (pDCErm), or pDCErmbspC GLM (pGLM) and then sacrificed after 48 hours. (A) Half of each mouse brain was homogenized and plated on THA-Erm to determine bacterial burden. (B) Blood from each mouse was also plated on THA-Erm to determine bacterial burden. For (A) and (B), data is pooled from three independent experiments, where each dot represents an individual mouse, and lines indicate statistical means. (C) H&E stains showing representative images of the leptomeninges from two individual mice per group. Arrows indicate areas of leukocyte infiltration and meningeal thickening. (D) ImageJ was used to analyze meningeal thickness from 3 mice per group. Two images were taken of each brain, and three distinct regions per image were measured with each dot representing an individual region. (E) KC protein concentration was quantified via ELISA from the brain homogenates shown in A. Data for E is pooled from three independent experiments, where each dot represents an individual mouse brain, and lines indicate statistical means. Statistical analysis: (A, B, C, and D) One-way ANOVA with Tukey’s multiple comparisons. *, P < 0.05; **, P < 0.005; ****, P < 0.00005.

