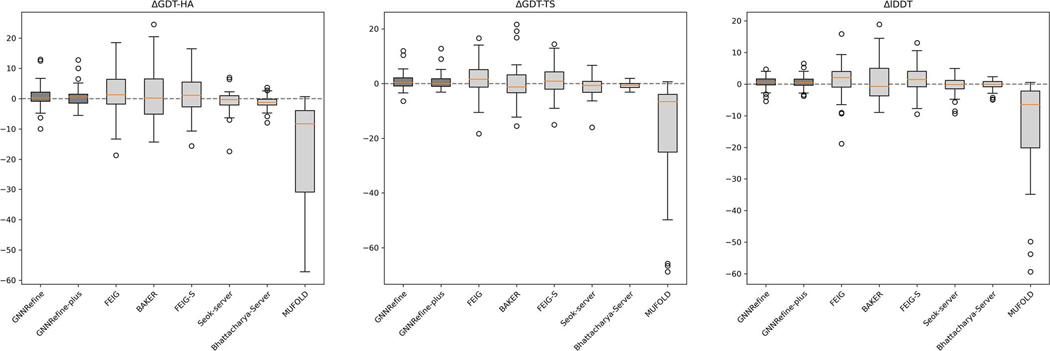
Extended Data Fig. 2. Quality improvement by different methods on the CASP14 refinement targets.
Box plot of the distribution of ΔGDT-HA, ΔGDT-TS, and ΔlDDT on the CASP14 refinement targets.The five lines in each boxplot from top to bottom in turn mean: Maximum (Q3+1.5IQR), Third quartile (Q3, 75th percentile), Median (50th percentile), First quartile (Q1, 25th percentile), and Minimum (Q1–1.5IQR), where IQR is Q3-Q1. The precision is 2.

