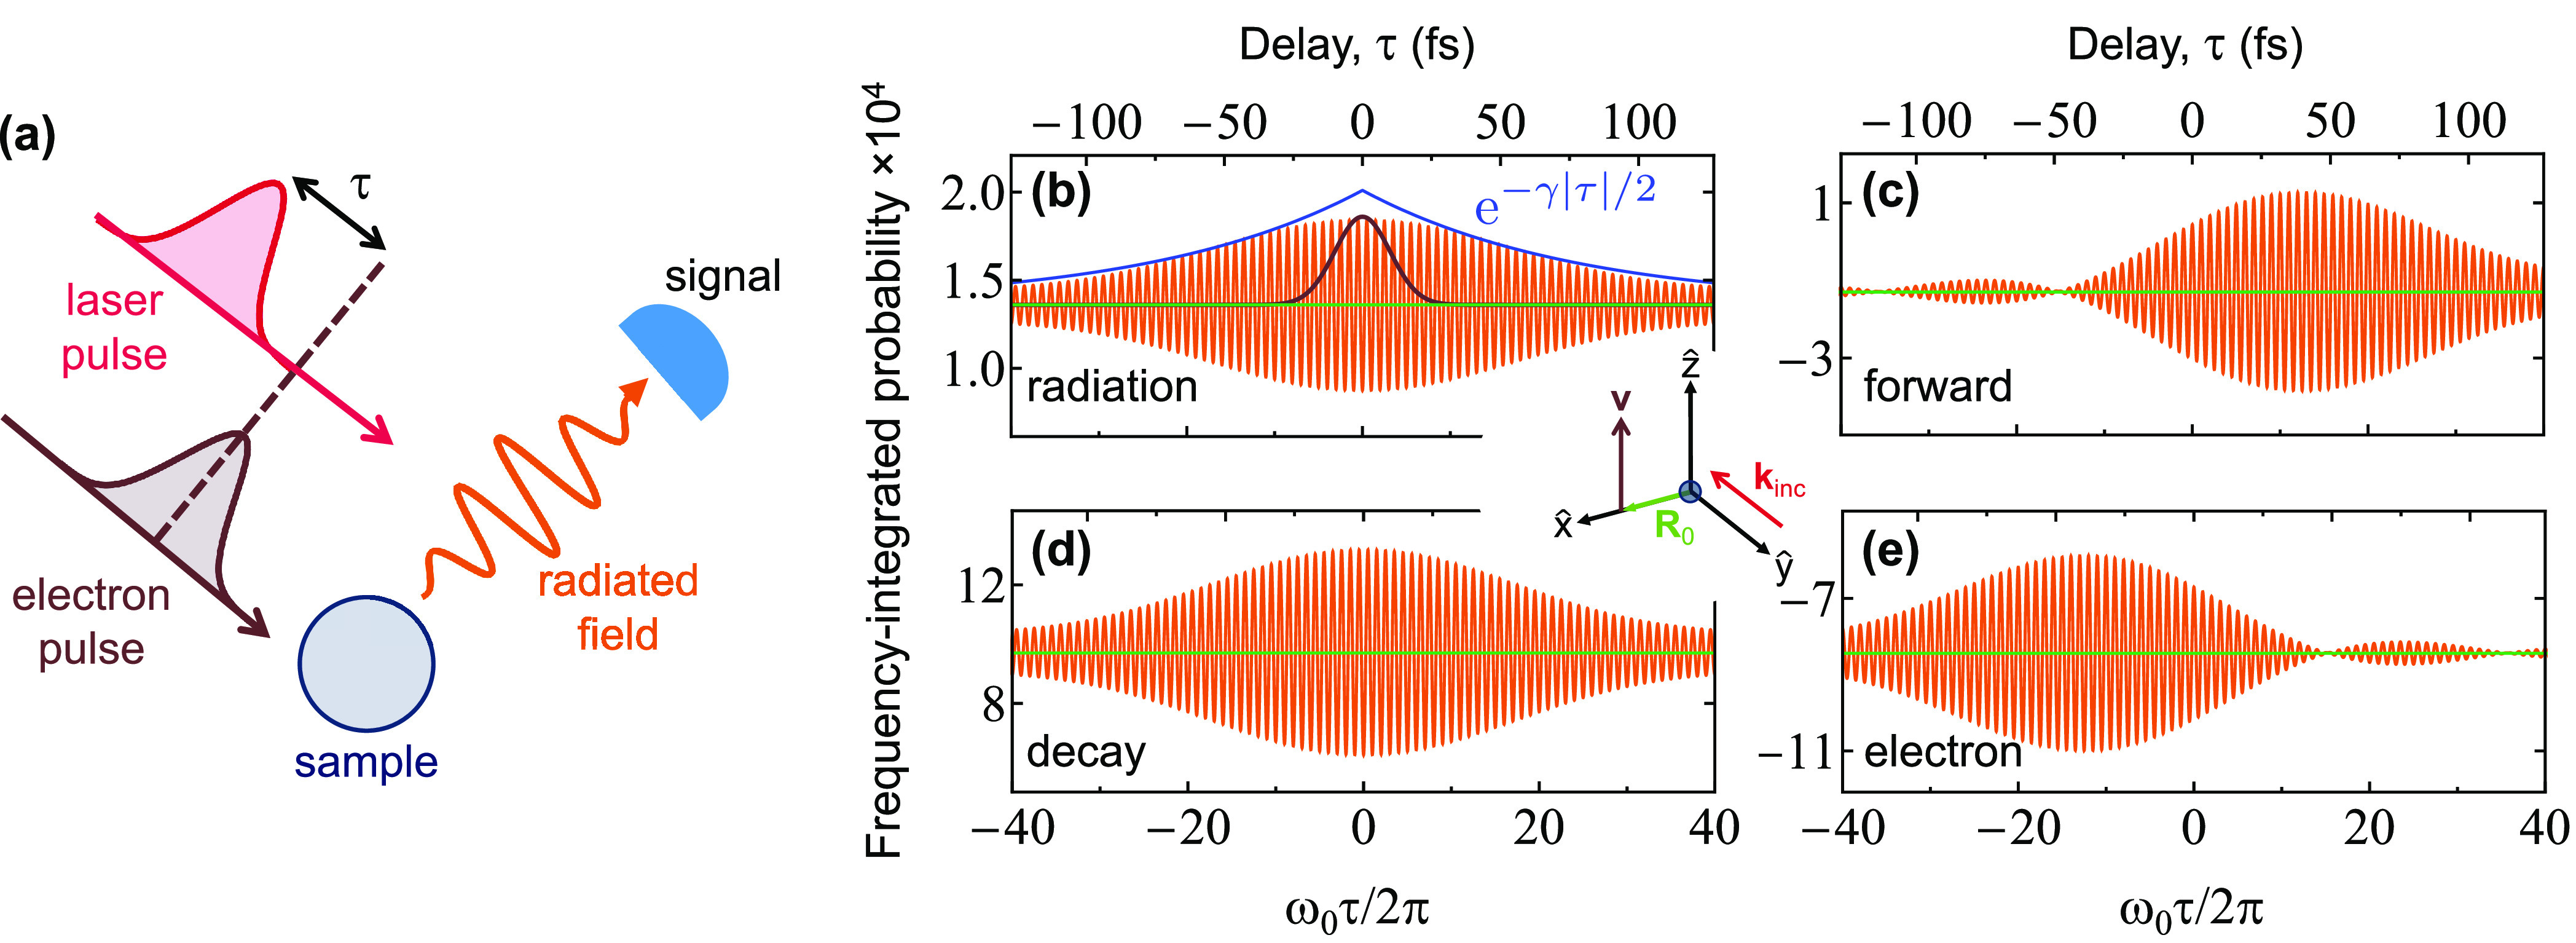
Figure 5.

Control of the far-field photon intensity and energy pathways through the electron-laser temporal delay. (a) We consider the same configuration as in Figure 2, using electron and laser Gaussian pulses that act on the sample with a relative time delay τ. (b) Angle- and frequency-integrated photon intensity (orange, in units of photons per electron, multiplied by 104), showing oscillations of period 2π/ω0 as a function of τ, as calculated for 100 keV electrons, 10 fs Gaussian pulse durations (i.e., f(ω) = e–(ω–ω0)2σt2/2; see black profile for comparison, corresponding to the profiles of electron density and laser field amplitude), and the same particle as in Figure 2a. The interference attenuation for γτ ≫ 1 is indicated by the blue curve, where γ is the decay rate of the sampled resonance. The laser field amplitude is fixed to (1.4 eω0/v2γ)f(ω). (c−e) Frequency-integrated probability associated with additional energy pathways: laser-stimulated forward scattering (c), total decay following excitation of the particle plasmon (d), and change in the electron energy (e). Calculations in (b−e) correspond to the orientations of the light (incident wave vector kinc) and the electron (velocity v) shown in the central inset.
