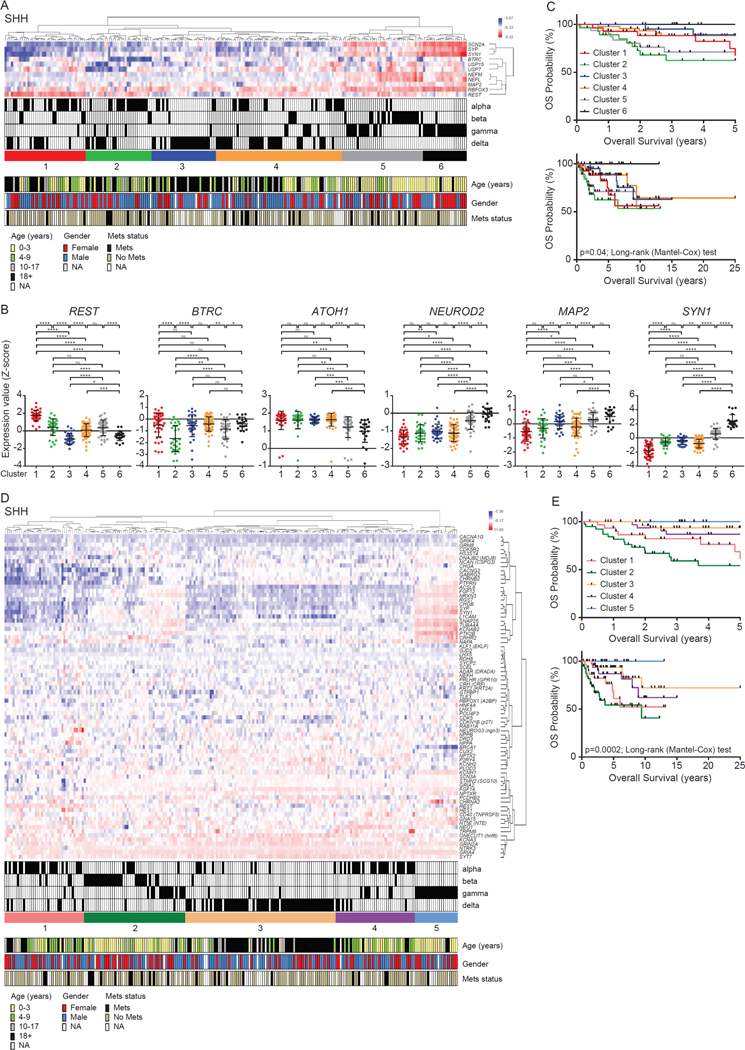
Figure 1: Clinical characteristics based on gene expression profiles.
(A) Hierarchical clustering analysis of SHH MB patient samples using gene expression. Hierarchical clustering assay identified six distinct clusters based on expression profiles of neuronal differentiation markers (www.ncbi.nlm.nih.gov/geo; dataset GSE85217). The blue to red color scale indicates the expression level (Z-score). The key, clinical information (subtype, age, gender and metastasis status) regarding patient samples, is provided beneath. (B) Gene expression profiles measured by microarray in six clusters. Each dot corresponds to one individual patient. Data show individual variability and means with S.D. ns; not significant, *; p<0.05, **; p<0.01, ***; p<0.001, ****; p<0.0001. (C) Overall survival of six clusters in SHH MB patients (p-value; log rank Mantel-Cox test). (D) Hierarchical clustering analysis of SHH MB patient samples using gene expression. Hierarchical clustering assay identified five distinct clusters based on expression profiles of REST target genes. The blue to red color scale indicates the expression level based on Z-score. The clinical information (subtype, age, gender and metastasis status) regarding patient samples was shown in the bottom panel. (E) Overall survival of five clusters in SHH MB patients (p-value; log rank Mantel-Cox test).

