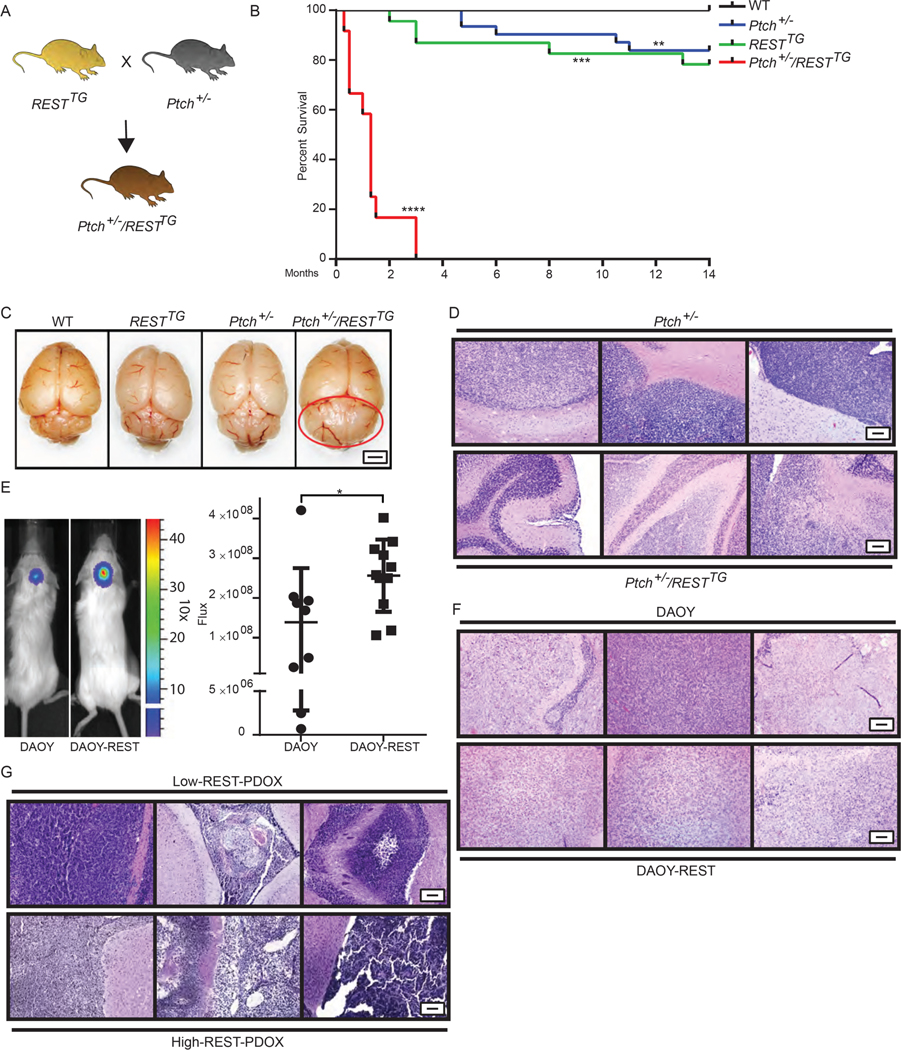
Figure 3: REST elevation alters kinetics and penetrance of Shh-driven MB development.
(A) Schema to describe generation of Ptch+/−/RESTTG mice. (B) Survival of WT (n=45), RESTTG (n=23), Ptch+/− (n=31), and Ptch+/−/RESTTG (n=13) mice following TX administration to induce REST Tg expression in RESTTG and Ptch+/−/RESTTG mice was assessed by Kaplan Meier analysis. (C) Representative gross images of brains from p40 WT, RESTTG, Ptch+/− and Ptch+/−/RESTTG mice are shown (n=3). Red circle indicates cerebellar tumor in p40 Ptch+/−/RESTTG mice. Scale bar = 2 mm. (D) H&E staining of brain tissue from Ptch+/− and Ptch+/−/RESTTG animals (n=3) are shown. (E) Immunodeficient mice bearing cerebellar xenografts of human DAOY cells expressing endogenous REST (n=9) or hREST (DAOY-REST (n=11) were monitored for tumor growth by BLI. Images of representative mice and relative flux for the entire cohort are shown prior to euthanasia on day 47 due to tumor burden. P values were obtained using Student t test. H&E staining of brain tissue from (F) DAOY and DAOY-REST xenografts (n=3), and (G) Low REST and High REST patient derived MB xenografts (PDOX) (n=3) are shown. For (D, F, and G), scale bars = 50 μm (10X).

