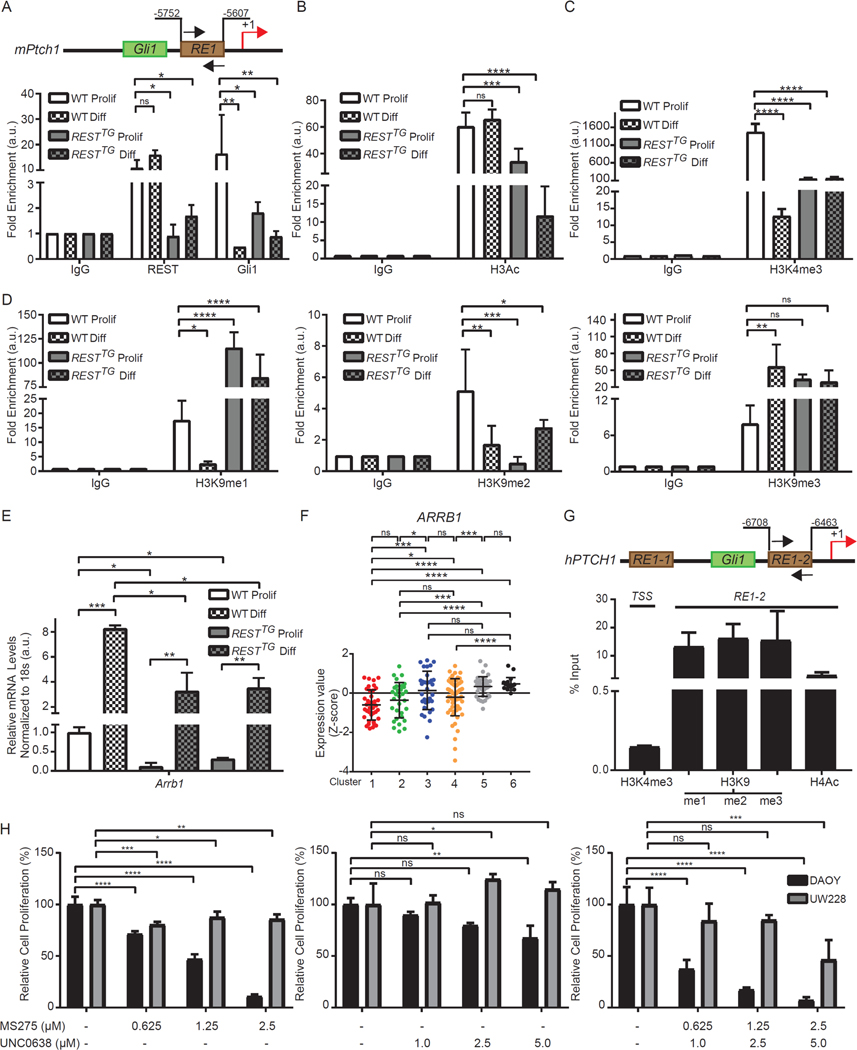
Figure 5: Transcription factor binding and resulting histone modification changes leads to Ptch1 loss of heterozygosity.
(A) Schematic representation of mPtch1 promoter with RE1 site and adjacent Gli1 binding site are shown. REST and Gli1 binding to RE1 site on mPtch1 promoter measured by ChIP-qPCR in WT and RESTTG proliferating and differentiating CGNPs. Data are represented as fold change over IgG (n=3 for WT and n=6 for RESTTG ). (B) Enrichment of H3Ac over IgG at mPtch1 promoter in proliferating and differentiating CGNPs. Bars represent fold change of H3Ac over IgG in the samples (n=3 for WT and n=6 for RESTTG ).(C) Enrichment of trimethylation at Histone H3 lysine 4 (H3K4me3) evaluated by ChIP-qPCR at the mPtch1 TSS site in WT and RESTTG proliferating and differentiating CGNPs (n=3). (D) Enrichment of mono, di and trimethylation at Histone H3 lysine 9 (H3K9me1, 2 and 3) evaluated by ChIP-qPCR at the mPtch1 RE1 site in WT and RESTTG proliferating and differentiating CGNPs (n=3). (E) Arrb1 mRNA expression was measured in WT and RESTTG CGNPs after culturing with proliferation or differentiation media. WT data represents the mean ± S.D. from triplicate samples, RESTTG data represents two individual pups.Graph represents fold change compared to WT proliferating controls. (F) ARRB1 mRNA expression profile measured by microarray. Hierarchical clustering based on expression levels of neuronal differentiation markers divided the SHH MB patient samples into six distinct clusters. Each dot corresponds to one individual patient. (G) Enrichment of H3K4me3 at hPTCH1 TSS and enrichment of other histone modifications at hPTCH1 RE1 site using ChIP-qPCR from a High-REST PDOX sample. (H) DAOY MB cell line treated with either HDAC inhibitor MS275 (0.625 μM to 5 μM) or G9a inhibitor UNC0638 (0.5 μM to 5 μM), or a combination of both, and MTT assay was performed at 48 hours post treatment to measure cell viability. Bars represent mean with S.D. of triplicate. For (A –D), statistical significance was obtained using two-way ANOVA in the Graphpad software and p values calculated using Dunnett’s method for multiple comparisons. For (E), p values were calculated by paired two-tailed t test of ΔCp values: significance is indicated as not significant (ns), p<0.05 (*), p<0.01 (**), p<0.001 (***), or p<0.0001 (****). For (H), statistical significance was calculated using two-way ANOVA in the Graphpad software and p values were measured by multiple comparisons using either Sidak or Tukey’s test (Graphpad 7.0).

