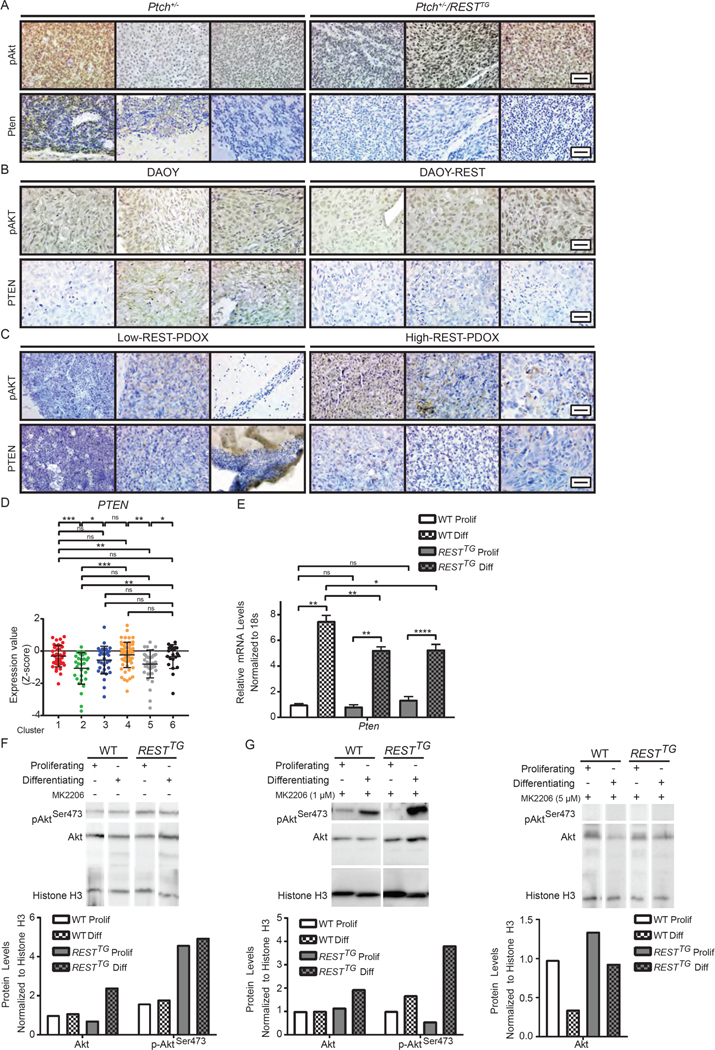
Figure 6: REST elevation in the context of constitutive SHH signaling results in AKT hyperactivation.
(A to C) IHC was performed with p-AKTSer473 or PTEN specific antibodies in (A) Ptch+/− and Ptch+/−/RESTTG tumors (n=3) (B) DAOY and DAOY-REST xenografts (n=3) and (C) human SHH- subgroup patient derived xenografts (n=3). (D) PTEN mRNA expression profile was measured by microarray. Hierarchical clustering based on expression levels of neuronal differentiation markers divided the SHH MB patient samples into six distinct clusters. Each dot corresponds to one individual patient. (E) Pten mRNA expression was measured in WT and\RESTTG CGNPs after culturing with proliferation or differentiation media. Graph represents fold change compared to WT proliferating controls. WT data represents the mean ± S.D. from triplicate samples, RESTTG data represents two individual pups. (F) Western blot analysis was used to measure p-AktSer473 and total Akt protein expression in WT (n=2) and RESTTG (n=2) CGNPs after culturing with proliferation or differentiation media. Representative Western images of p-AktSer473, Akt, and input control histone H3 are shown. (G) p-AktSer473 and total Akt protein expression were measured after 5 hours of treatment of proliferating and differentiating WT and RESTTG CGNPs with MK2206 (1 or 5μM) (n=2). Representative Western images of p-AktSer473, Akt and histone H3 (control) are shown. For (A, B, and C), scale bars = 20 μm (40X). For (E), p values for qRT-PCR were calculated by paired two-tailed t test of ΔCp values: significance is indicated as not significant (ns), p<0.05 (*), p<0.01 (**), p<0.001 (***), or p<0.0001 (****).

