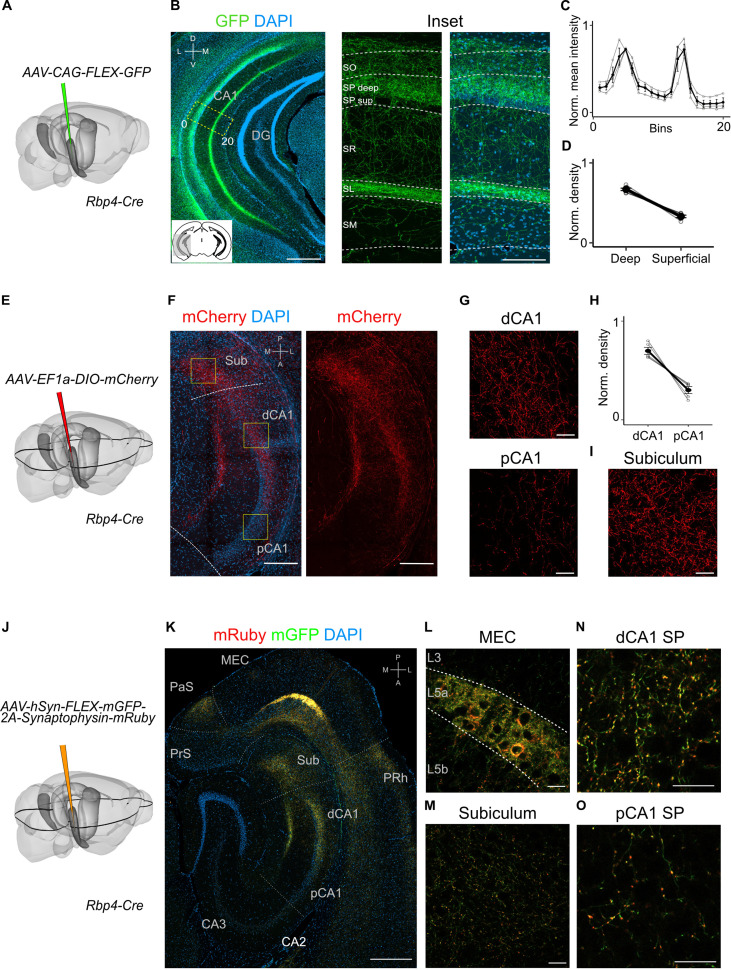
Figure 2. Projections to CA1 of L5a neurons of the medial entorhinal cortex (MEC) have distinct topography.
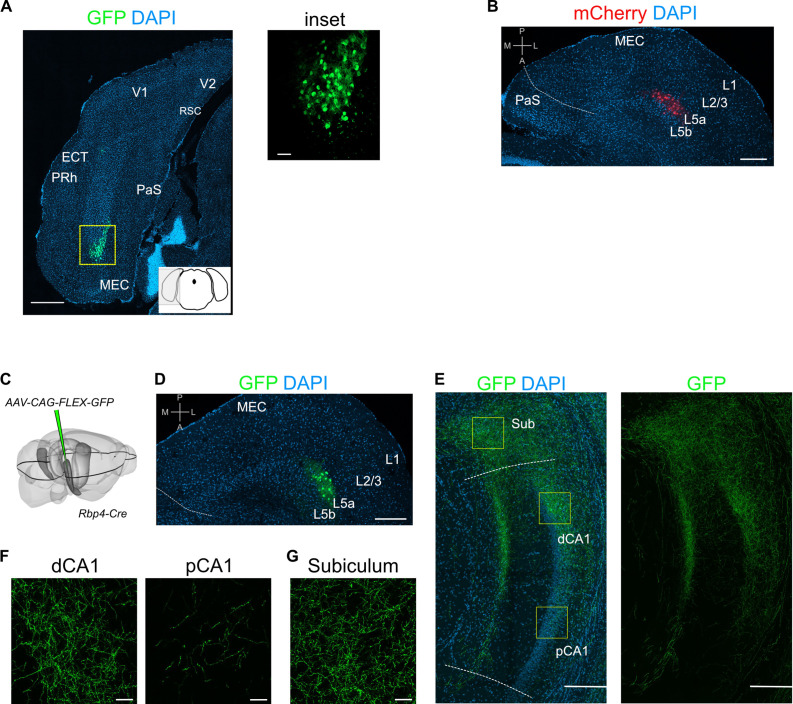
(A) Schematic showing the injection strategy of a Cre-dependent virus in the deep MEC of Rbp4-Cre mice. (B) Immunostained coronal brain section showing the distribution of axons of MEC L5a cells in CA1 (scale bar: 500 μm). Inset: high-magnification image of boxed region in left panel (scale bar: 100 μm). Bottom-left schematic indicates the antero-posterior position of the slice. Corresponding injection site image is shown in Figure 2—figure supplement 1A. SO, stratum oriens; SP, stratum pyramidale; SR, stratum radiatum; SL, stratum lacunosum; SM, stratum moleculare; D, dorsal; V, ventral; M, medial; L, lateral. (C) Quantification of fluorescence intensity of green fluorescent protein (GFP) across the layers of CA1. The area between 0 and 20 in (B) was divided into 20 equally sized bins, and the mean fluorescence intensity was calculated for each bin. Values shown are normalized mean fluorescence intensity values (n = 6 mice, 2 sections per brain). (D) Normalized mean fluorescence density values in deep versus superficial SP (n = 6 mice). Within SP, axon density in deep SP was significantly higher than density in superficial SP (paired one-tailed Wilcoxon signed rank test, p = 0.0156, n = 6). (E) Schematic showing the injection strategy of a Cre-dependent virus in the deep MEC of Rbp4-Cre mice. The black outline in the horizontal plane roughly corresponds to the dorso-ventral position of the horizontal slice shown in (F).( F) Immunostaining of a horizontal brain section showing the distribution of axons of MEC L5a cells in the subiculum (Sub), distal CA1 (dCA1), and proximal CA1 (pCA1; scale bar: 200 μm). Corresponding injection site image is shown in Figure 2—figure supplement 1B. (G) High-magnification images of the pyramidal cell layer in distal (top) and proximal (bottom) CA1 showing axonal labelling (scale bar: 20 μm). (H) Normalized mean fluorescence density values in distal versus proximal CA1 (n = 5 mice). (I) High-magnification image of the subiculum showing axonal labelling (scale bar: 20 μm). (J) Schematic showing the injection strategy of an adeno-associated viral vector (AAV) for Cre-dependent expression of a membrane-bound form of GFP and a synaptophysin–mRuby conjugate in L5a of the MEC in the Rbp4-Cre mice. The black outline in the horizontal plane roughly corresponds to the dorso-ventral position of the slice shown in (K). (K) Immunostained brain section in the horizontal plane showing the distribution of axons (green) and synaptic terminals (red) in the hippocampus as well as the parasubiculum (PaS) and perirhinal cortex (PRh). Injection site in the MEC is distinguishable by the strong fluorescent labelling of L5a cell bodies (scale bar: 400 μm). (L) High-magnification image of the injection site in the MEC showing cell membrane and synaptic labelling specifically in L5a (scale bar: 20 μm). (M) High-magnification image of the subiculum showing axonal and synaptic labelling (scale bar: 20 μm). High-magnification images of the pyramidal cell layer in distal (N) and proximal (O) CA1 showing axonal and synaptic labelling (scale bar: 20 μm).


