. 2022 Mar 22;11:e74650. doi: 10.7554/eLife.74650

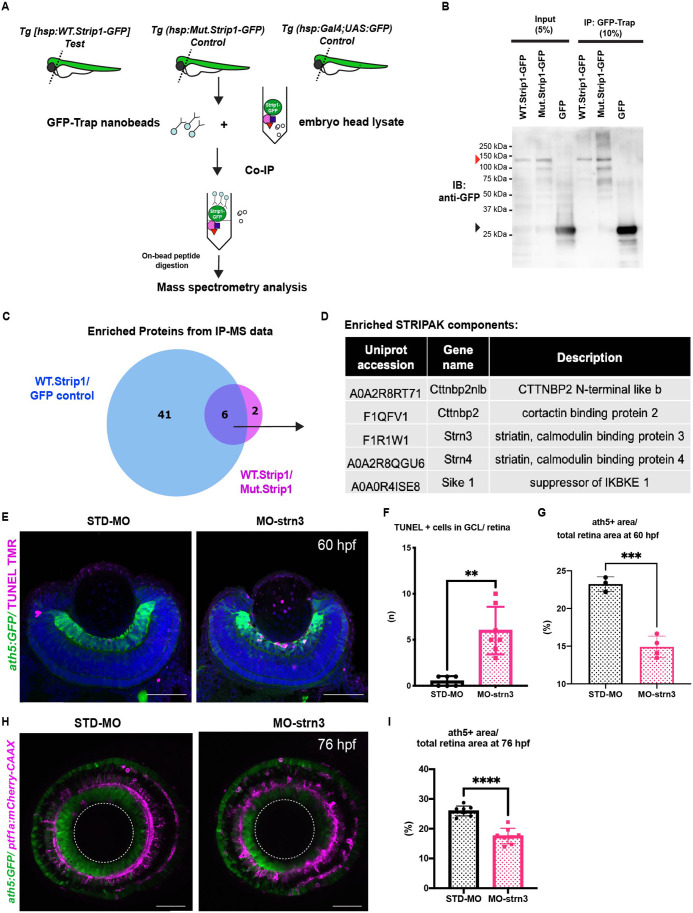
Figure 5. Strn3 is a Strip1-interacting partner that promotes retinal ganglion cell (RGC) survival.

(A) Design of co-immunoprecipitation coupled with mass spectrometry (Co-IP/MS) to identify zebrafish Strip1-interacting partners. Embryos carrying the transgenes Tg[hsp:WT.Strip1-GFP], Tg[hsp:Mut.Strip1-GFP], or Tg[hsp:Gal4;UAS:GFP] were used to pull-down wild-type GFP-tagged Strip1, mutant GFP-tagged Strip1 or only GFP, respectively. Head lysates from 2-dpf zebrafish embryos were subjected to immunoprecipitation using GFP-Trap beads. Immunoprecipitates were digested and analyzed by mass spectrometry (MS). (B) Western blotting of whole head lysates (input) and immunoprecipitates (IP) using anti-GFP antibody. Red and black arrowheads indicate the expected band sizes for Strip1-GFP (120 kDa) and GFP (26 kDa), respectively. (C) Venn diagram comparing proteins significantly enriched in WT.Strip1-GFP relative to Control GFP (blue) and WT.Strip1-GFP relative to Mut.Strip1-GFP (magenta). Six proteins are commonly enriched in both groups, FC >2, p  <  0.05. n = 3 for WT.Strip1-GFP and Mut. Strip1-GFP and n = 2 for GFP-control. (D) Five components of the STRIPAK complex found from six proteins commonly enriched in (C). (E) Transferase dUTP nick end labeling (TUNEL) of 60-hpf retinas of Tg[ath5:GFP] transgenic embryos injected with standard MO and MO-strn3. RGCs and apoptotic cells are labeled with ath5:GFP and TUNEL, respectively. Nuclei are stained with Hoechst (blue). (F) The number of TUNEL+ cells in ganglion cell layer (GCL). Mann–Whitney U-test, n ≥ 6. (G) Percentage of ath5+ area relative to total retinal area. Student’s t-test with Welch’s correction, n ≥ 3.(H) Confocal images of retinas of 76-hpf Tg[ath5:GFP; ptf1a:mCherry-CAAX] transgenic embryos injected with standard MO and MO-strn3. ath5:GFP and ptf1a:mCherry-CAAX label RGCs and amacrine cells (ACs), respectively. (I) Percentage of ath5+ area relative to total retinal area. Student’s t-test with Welch’s correction, n = 8. Scale bar, 50 μm (E, H). For all graphs, data are represented as means ± standard deviation (SD). **p < 0.01, ***p < 0.001, and ****p < 0.0001.

Figure 5—source data 1. Data for Figure 5B.
Figure 5—source data 2. Data for Figure 5C.
elife-74650-fig5-data2.xlsx (182.2KB, xlsx)
Figure 5—source data 3. Data for Figure 5F,G,I.

Figure 5.

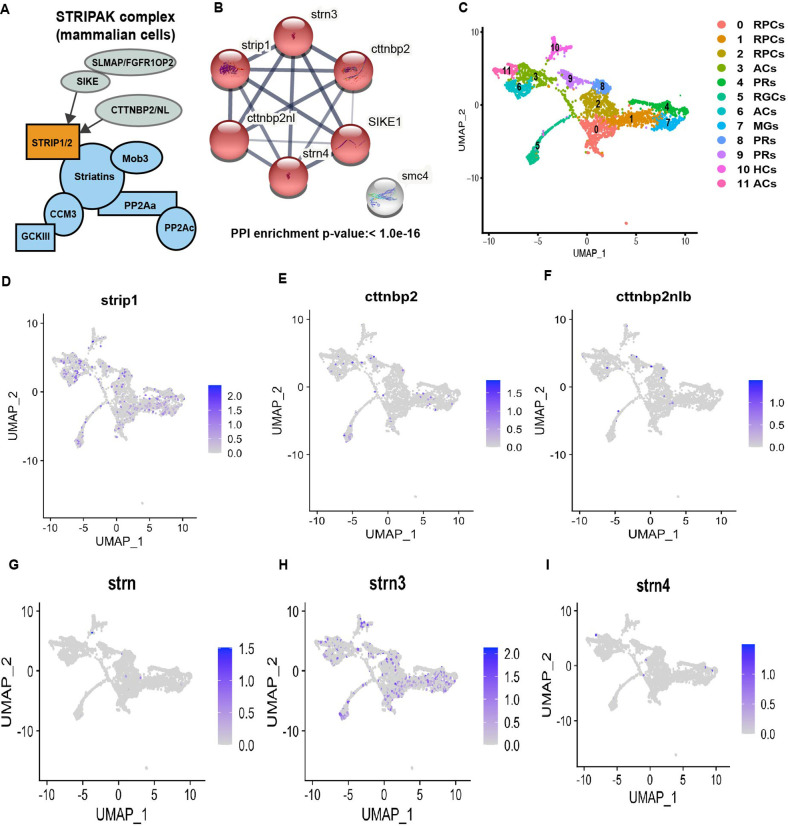
Figure 5—figure supplement 1. Components of the STRIPAK complex are highly enriched in the interactome of zebrafish Strip1 and their retinal expression, according to published scRNA-seq data.

Figure 5—figure supplement 1.

(A) Schematic diagram showing the core components of the mammalian STRIPAK complex and some of its accessory molecules. Core STRIPAK components include serine/threonine-protein phosphatase catalytic subunit known as PP2Ac and the scaffolding subunit PP2Aa, together with striatins (STRN, STRN3, and STRN4), Mob3, STRIP1, or STRIP2, and a germinal center kinase, GCKIII kinase, bound via cerebral cavernous malformation 3 (Ccm3). Some molecules bind in a mutually exclusive pattern to the core components. Arrows show that sarcolemmal membrane-associated protein (SLMAP) and the suppressor of IKKe (SIKE) are not detected in STRIPAK complexes containing cortactin-binding proteins (CTTNBP2/NL) and vice versa. (A has been adapted from Figure 3 in Hwang and Pallas, 2014). (B) STRING protein–protein interaction (PPI) network analysis of six zebrafish Strip1-interacting partners significantly enriched from IP-MS analysis highlighted in Figure 5C. Network edges represent known and/or predicted functional interactions in the STRING database. Edge thickness reflects the combined STRING evidence score for each binary relationship. Thicker edges represent increased interaction evidence. PPI enrichment p value <1.0e−16. (C) Uniform Manifold Approximation and Projection (UMAP) plots showing different clusters of retinal cells at 48 hpf analyzed with Seuret R pipeline using data published by Xu B. et al. (2020). Twelve clusters are identified and categorized to different retinal cell types or subtypes. RPCs, retinal progenitor cells; RGCs, retinal ganglion cells; ACs, amacrine cells; BPs, bipolar cells; HCs, horizontal cells; PRs, photoreceptors; MGs, Müller glia. UMAP plots showing retinal mRNA expression patterns of strip1 (D) and its interacting STRIPAK components, identified from Co-IP/MS; cttnbp2 (E), ttnbp2nlb (F), strn (G), strn3 (H), and strn4 (I). Only strip1 and strn3 show high retinal expression levels at 48 hpf compared to other partners.
Figure 5—figure supplement 2. Efficient and specific knockdown of zebrafish Strn3 using morpholinos.
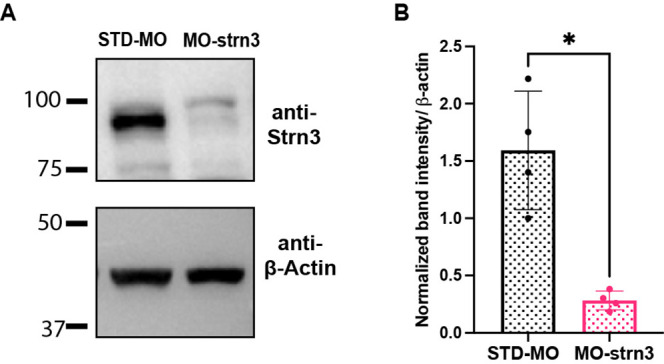
Figure 5—figure supplement 2.

(A) Western blotting of 2-dpf head lysates from STD-MO-injected and MO-strn3-injected wild-type embryos. A ~90 kDa band corresponding to zebrafish Strn3 is reduced in the morphants. (B) Quantification of Strn3 protein level relative to loading control protein, β-actin. Mann–Whitney U-test, n = 4. Data are represented as means ± standard deviation (SD). *p < 0.05.
Figure 5—figure supplement 2—source data 1. Data for Figure 5—figure supplement 2A.
Figure 5—figure supplement 2—source data 2. Data for Figure 5—figure supplement 2B.