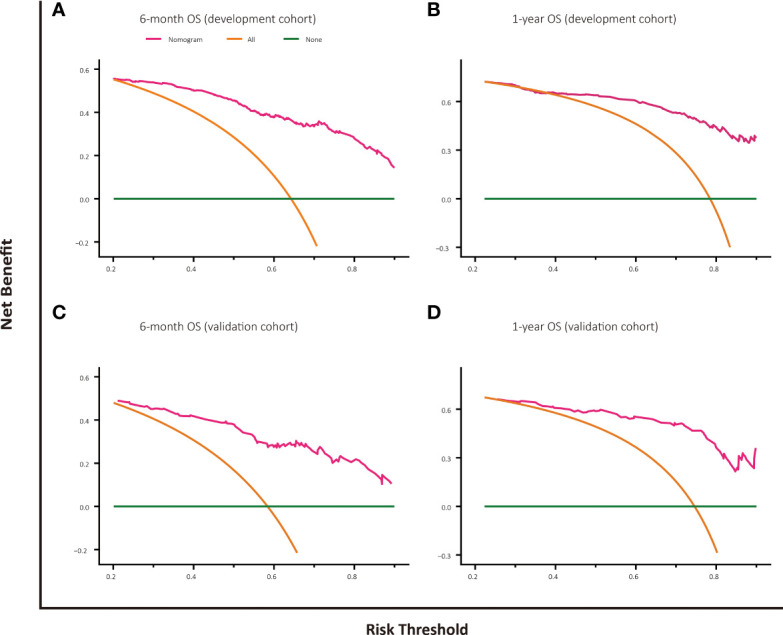
Figure 5.

Decision curve analysis for OS prediction at 6 months and 1 year in the development and validation cohorts. (A) DCA for 6-month OS predction in the development cohort. (B) DCA for 1-year OS prediction in the development cohort. (C) DCA for 6-month OS prediction in the validation cohort. (D) DCA for 1-year OS prediction in the validation cohort.
