FIGURE 3.
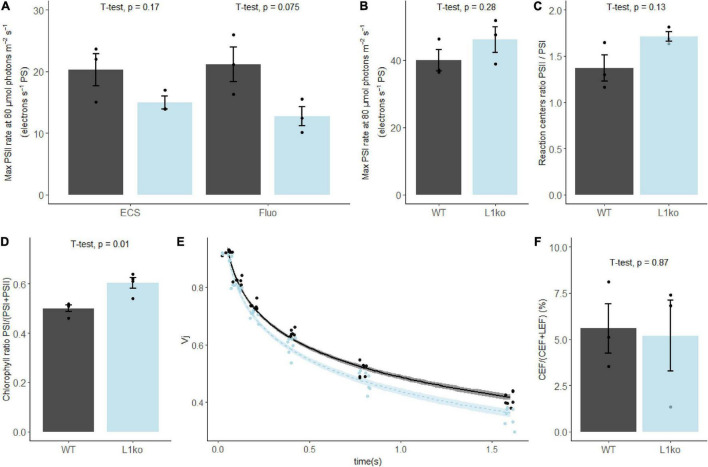
In plants lacking LHCB1, the chlorophyll repartition is shifted toward PSI. (A) The maximal photochemical rate of PSII, measured by electrochromic shift (ECS) and fluorescence (fluo) and (B) PSI measured by ECS. (C) The ratio of PSI/PSII reaction centers measured by a single turnover flash. (D) The average PSI/(PSI + PSII) Chl ratio determined from the 100 ps component of the fluorescence decay measured in fully expanded leaves, excitation wavelength at 633 nm and fluorescence emission at 710–750 nm (see Supplementary Figure 5). (E) Fluorescence value measured at 3 ms during a 700 ms saturating pulse normalized over the maximal fluorescence (VJ), upon sequential incubations of the sample with far-red light with increasing time intervals. The points were fitted with a local regression algorithm based on a logarithmic function to visually represent the data distribution in function of the time with a continuous error estimate (black continuous line WT, light blue L1ko). The standard error of the interpolation is shown as a gray area around the curves. (F) Contribution of CEF to the total electron flow in WT and L1ko expressed as a percentage of the electron flow. Individual biological replicates are plotted as points, the histogram shows the average, and the error bars represent the standard error (n = 3, n = 4 for E). The averages of the distributions were compared with Student’s t-test, and the p-value of the comparison between WT and L1ko reported above the bars.

