FIGURE 4.
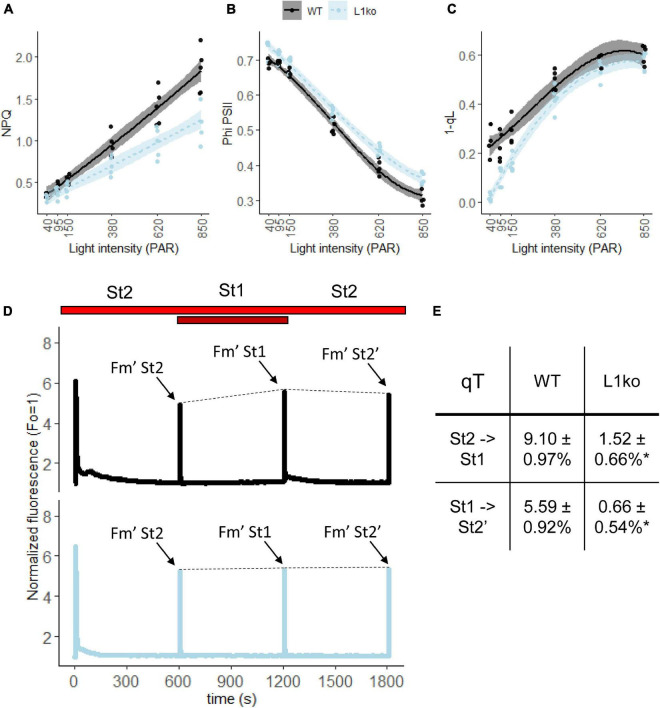
Loss of LHCB1 alters the equilibrium of the LEF between PSII and PSI. The LEF was monitored by room temperature Chl fluorescence on adult WT (black lines) and L1ko (light blue lines) plants. The plants were exposed to a range of increasing light intensities, each lasting 5 min. (A) Non-photochemical quenching (NPQ), (B) quantum efficiency of PSII, referred as ΦPSII in the main text. (C) Fraction of closed PSII centers estimated by the 1 qL parameter. Each experimental point is displayed as a dot. The measured points were fitted with a second-degree polynomial function for NPQ, a third-degree polynomial for ΦPSII and 1-qL to visually represent the data distribution and the standard error for WT (the black line and the gray area) and L1ko (the blue dotted line and the light blue area). Post hoc analysis of the models shows that there is a significant difference between L1ko and WT (p < 0.001). (D) Chl a fluorescence traces measured during shifts from State 2 (St2) to State 1 (St1), light and back. The line represents the average fluorescence and the area the standard deviation (n = 3) for WT (upper, the black line) and L1ko (lower, the blue line). The bars at the top indicate illumination with red (shown in red) and far-red (dark red) light. The dashed line connecting the Fm’ peaks was added to highlight the state transitions. (E) qT values calculated as (Fm’St1-Fm’St2)/Fm’St2 ± SD (n = 3), the peaks used for the calculation are highlighted in (D), and the values indicated with an * are statistically different (p < 0.01).

