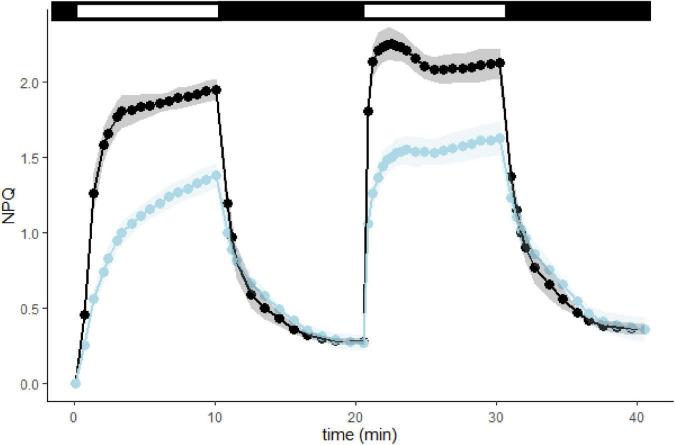
FIGURE 5.
L1ko is affected in the rapidly reversible component of NPQ (qE). NPQ kinetics with two periods of light induction, both at 1,000 μmol photons m– 2 s– 1, measured in WT and L1ko adult plants. The top bar shows the light exposition periods (white bars) and the dark relaxation (black bars). The points and the lines correspond to the average NPQ value recorded for each time from five biological replicates. The lines and areas show a continuous estimate of the average and the standard deviation for WT (the black line and the gray area) and L1ko (the blue line and the light blue area). The corresponding fluorescence traces are shown in Supplementary Figure 9.

