FIGURE 6.

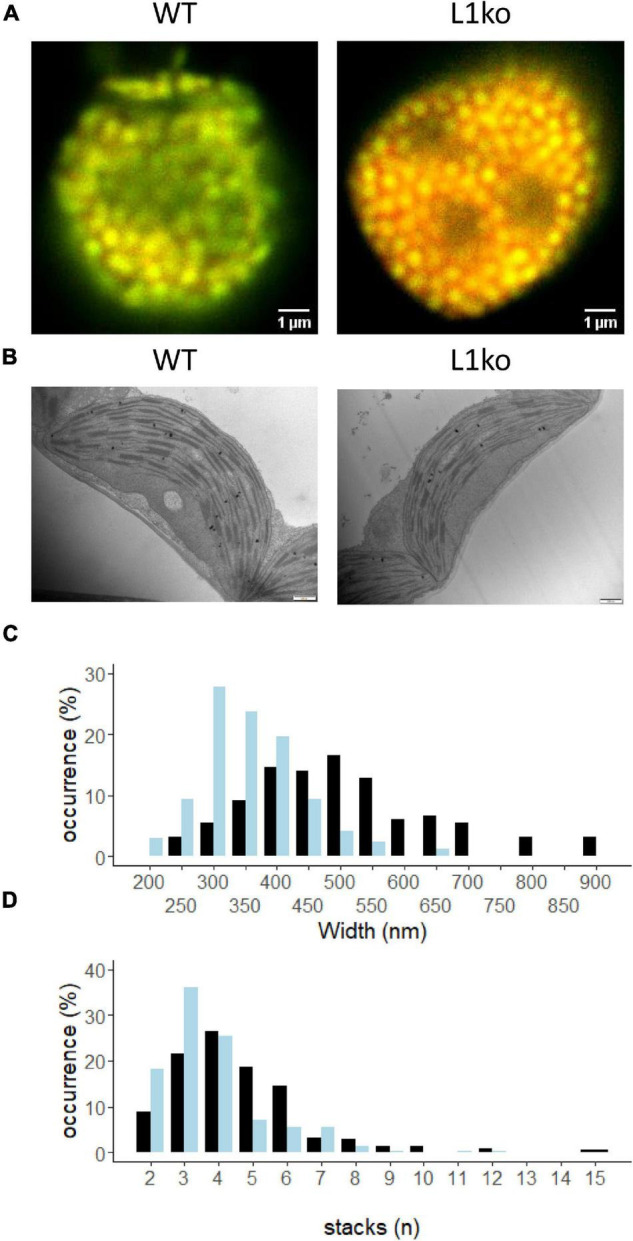
LHCB1 mutation affects the thylakoid structure. (A) Confocal microscopy on isolated chloroplasts of WT and L1ko. Excitation at 633 nm and detection at 650–680 nm are shown in green (PSII-maximum), while 710–750 nm detection in red (PSI-maximum). Red channel intensity has been increased 10 times in comparison to the green channel to compensate for decreased sensitivity of the detector and decreased fluorescence emission in the far-red region (see Supplementary Figure 10). (B) Representative images of chloroplasts from WT and L1ko leaves obtained by transmission electron microscopy. The scale bar is 500 nm (see Supplementary Figure 12). (C) Distribution of the grana width in WT and L1ko based on the measurement of 164 and 173 grana for WT and L1ko, respectively. (D) Distribution of the grana stacks divided by the number of layers based on the analysis of 215 and 241 grana for WT and L1ko, respectively. The chloroplast images used for the analysis were obtained from two independent biological samples. The statistical analysis of the grana stack number and width distributions is presented in the text.
