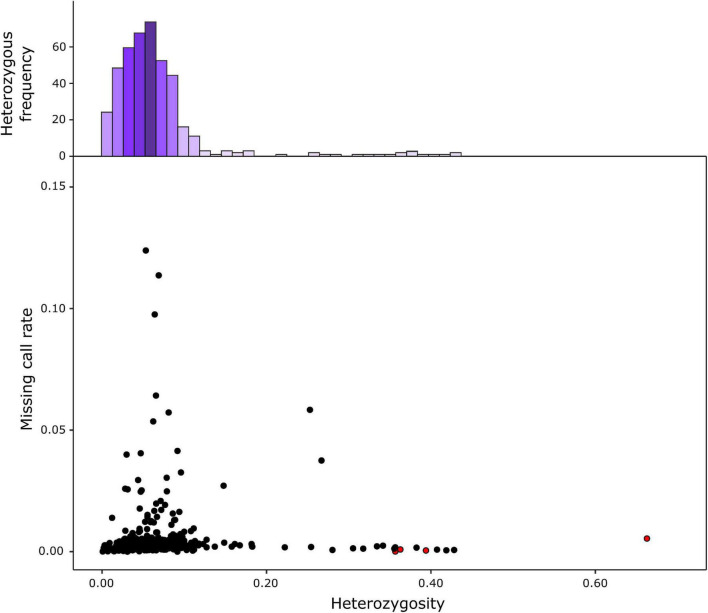
FIGURE 2.
Heterozygosity and proportion of missing data from the S3MEGGIC population. The top histogram represents the observed heterozygosity which is skewed to the left (mean 6.87%; mode 5.02%). The lower graph reports the residual heterozygosity of S3 individuals as black dots copared against two-way hybrids represented as red dots.

