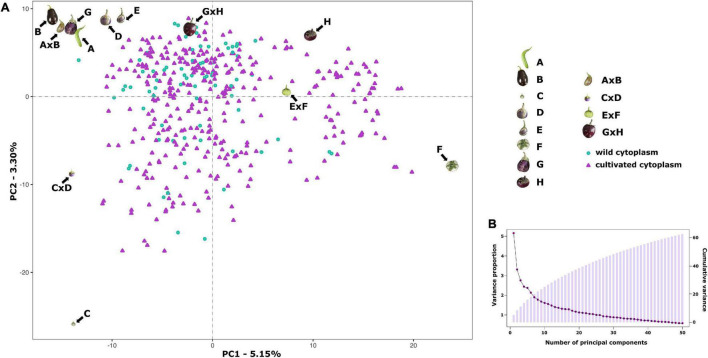
FIGURE 3.
Results of a Principal Component Analysis (PCA) on the S3MEGGIC population. (A) PCA of the first two principal components (PCs), including S3 individuals, founder lines, and two-way hybrids. S3 individuals with wild cytoplasm are represented with blue dots while those ones with cultivated cytoplasm are represented with purple triangles. (B) Scree plot of the PCs (x-axis) and their contribution to variance (left y-axis); bar blot of the PCs (x-axis) and the cumulative proportion of variance explained (right y-axis).

