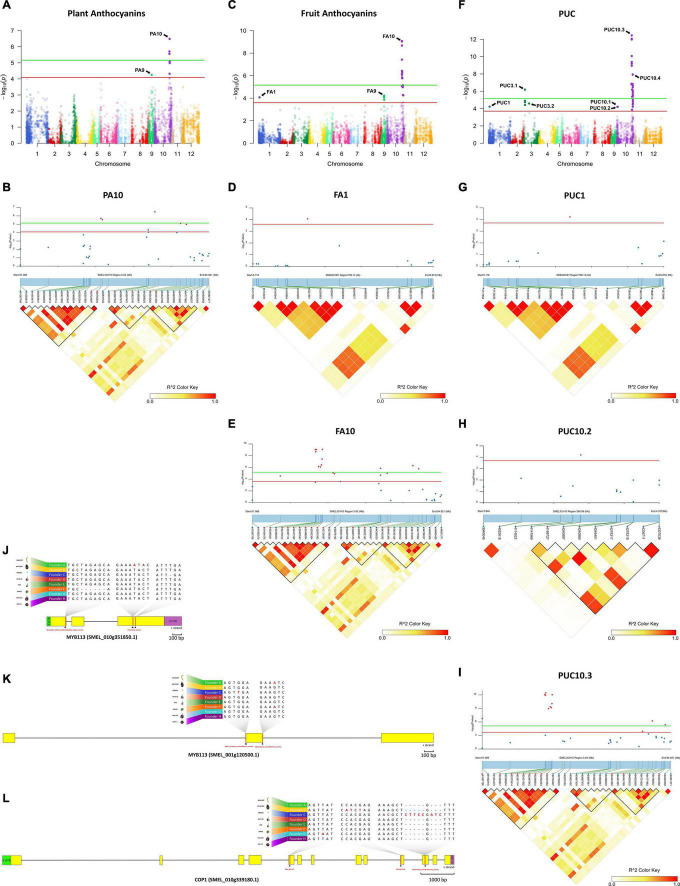
FIGURE 5.
Genome-wide association mapping with linkage disequilibrium (LD) block heatmap of significant regions and potential candidate genes controlling PA, FA, and PUC in eggplant. (A,C,F) Manhattan plot for PA (A), FA (C), and PUC (F). Arrows indicate the position of main peaks detected for each trait. The red and green horizontal lines represent, respectively, FDR and Bonferroni significance thresholds at p = 0.05. (B,D,E,G–I) Local Manhattan plot (top) and LD heatmap (bottom) surrounding the peaks PA10 (B), FA1 (D), FA10 (E), PUC1 (G), PUC10.2 (H) and PUC10.3 (I). Pairwise LD between SNPs is indicated as values of R2 values: red indicates a value of 1 and white indicates 0. (J–L) Structure of candidate genes MYB113 (SMEL_010g351850.1) (J), MYB113 (SMEL_001g120500.1) (K), and COP1 (SMEL_010g339180.1) (L) and effect of the high-impact variants detected in those of the eight founders.

