
FIGURE 3.
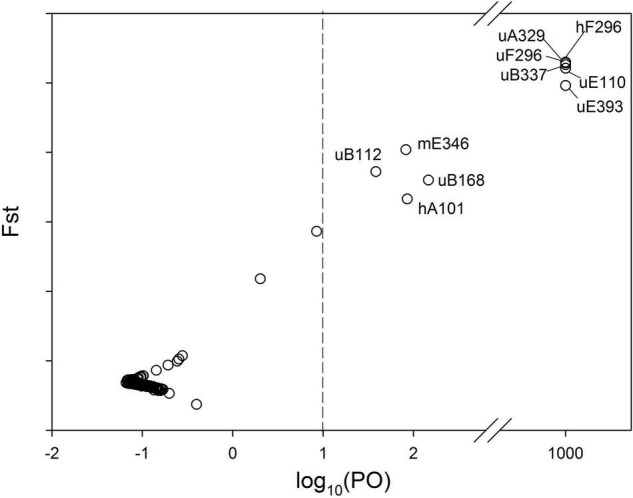
MSAP outliers identified by Bayescan. The posterior odds (PO) for a locus to be under divergent selection are shown on a log scale on the x-axis. The vertical dash line indicates the threshold for strong evidence for selection. Outliers on the right side of the vertical line are marked with their names.