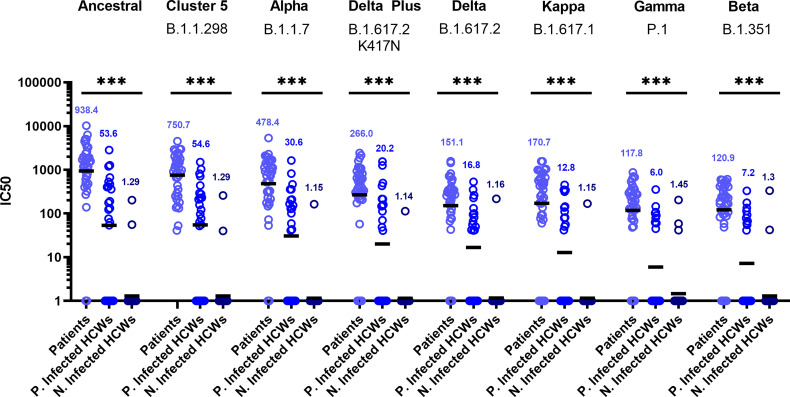
Figure 3.
Neutralisation titres split by well defined patient and healthcare worker cohorts. When neutralisation titres were split into cohorts of patients, previously infected HCWs and non-infected HCWs, we observe higher neutralisation titres amongst patients across all variants. ANOVA tests were used for statistical analysis between the cohort groups (p = <0.001). Black lines denote geometric means. Geometric means are reported above the datasets. ***p=<0.001.

