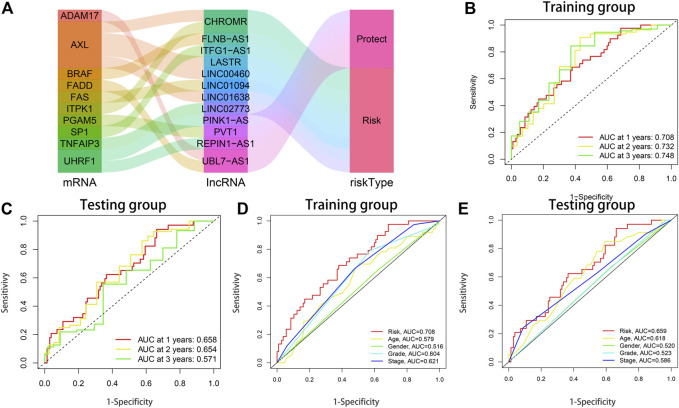
FIGURE 4.
The prognostic performance of the 12-lncRNAs signature in the training and testing sets. (A) The Sankey diagram shows the connection degree between the necroptosis-related lncRNAs and necroptosis-associated genes. (B) AUC of time-dependent ROC curves at 1-, 2-, and 3-years OS in the training set. (C) AUC of time-dependent ROC curves at 1-, 2-, and 3-years OS in the testing set. (D) ROC curve analysis of clinicopathological parameters and risk score in the training set. (E) ROC curve analysis of clinicopathological parameters and risk score in the testing set.

