
Figure 1: Aneurysm Growth Rate Distribution.
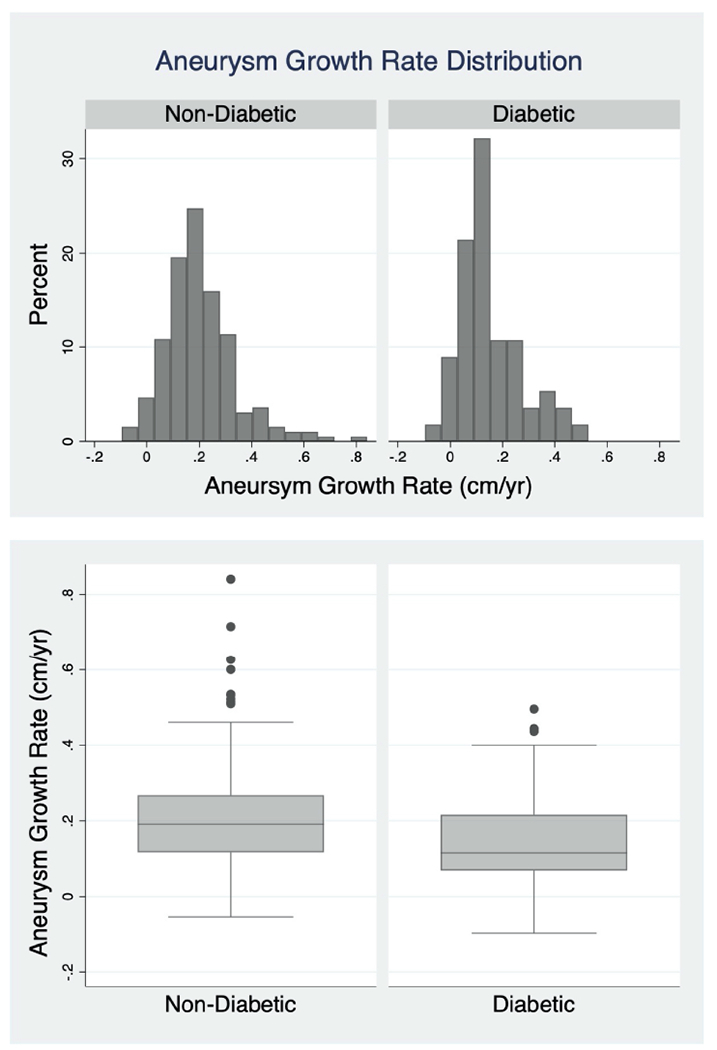
The distributions of the growth rates as calculated by linear regression are demonstrated by histogram above and the box and whisker plot below with the non-diabetic group on the left and diabetics on the right. Those with a diagnosis of diabetes exhibited a mean growth rate of 0.15 cm/yr (±0.13) and median rate of 0.12 cm/yr (IQR 0.07-0.22). Those without a diagnosis of diabetes exhibited a mean growth rate of 0.21 cm/yr (±0.14) and median rate of 0.19 cm/yr (IQR 0.12-0.27).