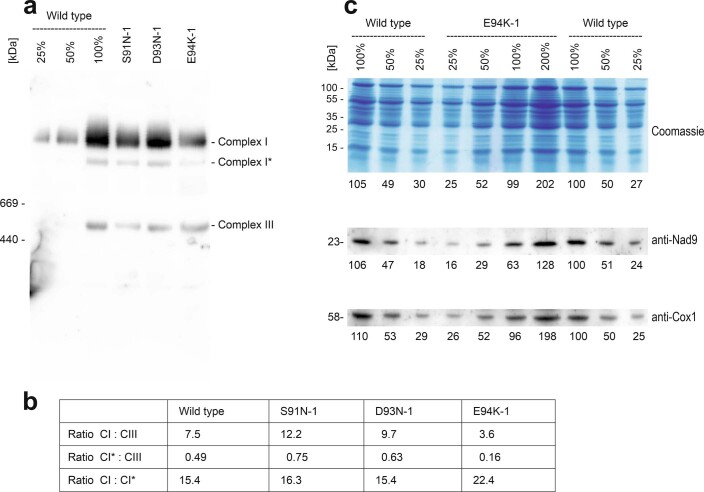
Extended Data Fig. 9. Characterization of complex I in a set of selected mitochondrial nad9 mutants.
(a) Analysis of complex I accumulation by BN-PAGE and immunoblotting. A replicate gel of the gel shown in Fig. 4a was blotted and hybridized to an anti-CA2 antibody recognizing one of the carbonic anhydrase subunits of complex I. One of two technical replicates with similar results is shown. (b) Quantification of the ECL signal intensities in the immunoblot shown in panel (a). (c) Quantification of Nad9 protein amounts in the nad9 E94K-1 mutant after SDS-PAGE analysis (in a 12% polyacrylamide gel) and immunoblotting. The percentages above the Coomassie-stained gel indicate the relative protein amounts loaded in each lane. The numbers below each panel represent the relative staining intensities (upper panel) and the intensities of the hybridization signals (middle and bottom panels). Quantification was done with the Fiji image processing package. The 100% wild-type sample in lane 8 served as reference. For information about the total number of SDS-PAGE and anti-Nad9 western blot experiments, see Fig. 4. The anti-Cox1 western blot was performed once. Quantifications were done based on the images shown here.

