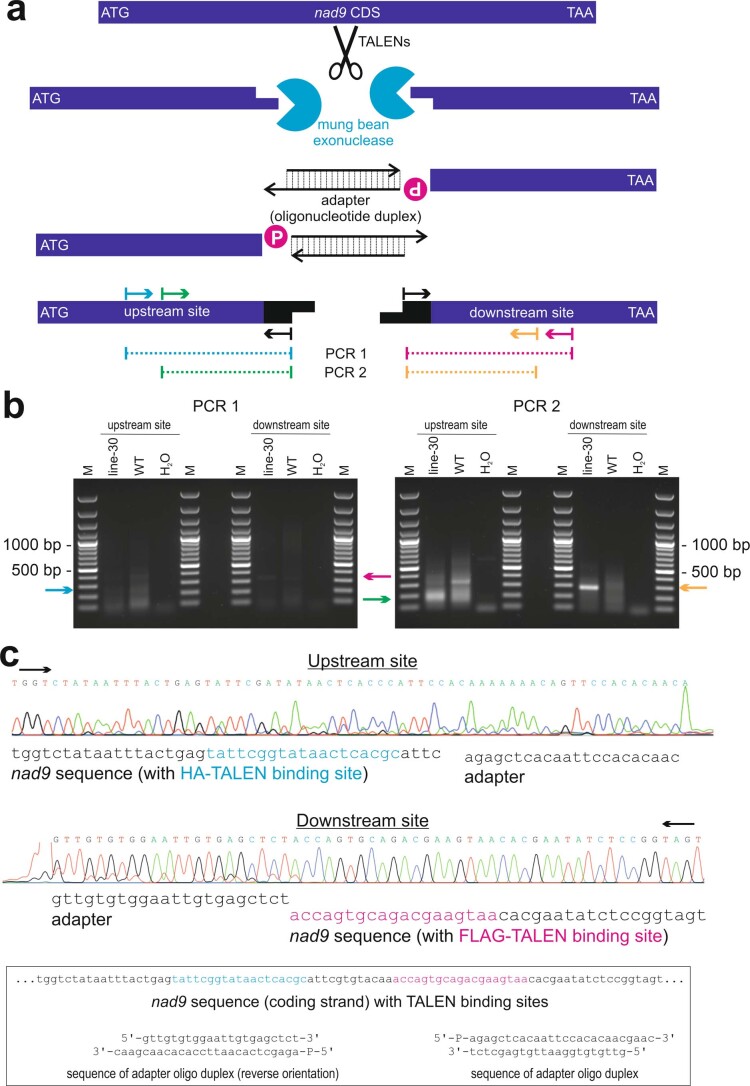
Extended Data Fig. 3. Detection of TALEN-induced DNA double-strand breaks.
(a) End-mapping strategy to verify that the TALENs cut at the predicted sites. Arrows indicate oligonucleotides or primer-binding sites. mtDNA cut by the TALENs in vivo is blunted by mung bean exonuclease in vitro, followed by adapter ligation and PCR amplification. Note that PCR 2 is a half-nested PCR using the products of PCR 1 as template. P, 5’ monophosphate group of oligonucleotides. (b) PCR results obtained from execution of the strategy depicted in panel (a). Arrows indicate the expected sizes of products derived from TALEN-cut mtDNA. Cyan arrow, expected size (270 bp) of the amplification product of upstream site PCR 1; magenta arrow, expected product size (350 bp) for downstream site PCR 1; green arrow, expected amplicon size (192 bp) for upstream site PCR 2; orange arrow, expected amplicon size (288 bp) for downstream site PCR 2; line-30, line Nt-JF1006-30; WT, wild-type control; H2O, water control; M, DNA size marker. One of two similar experiments with similar results is shown. (c) Sequencing chromatograms for the products of PCR 2. The chromatograms show the DNA sequence obtained from sequencing the PCR products marked by the green (upstream site) and orange (downstream site) arrows, respectively, in panel (b). For comparison, the sequences of the adapter oligonucleotide duplex and the nad9 TALEN target site are also given (boxed). Black arrows indicate the direction of the sequencing reactions.

