
Figure 2. Pharmacologic bone preservation improves muscle mass and strength in murine OvCa hosts.
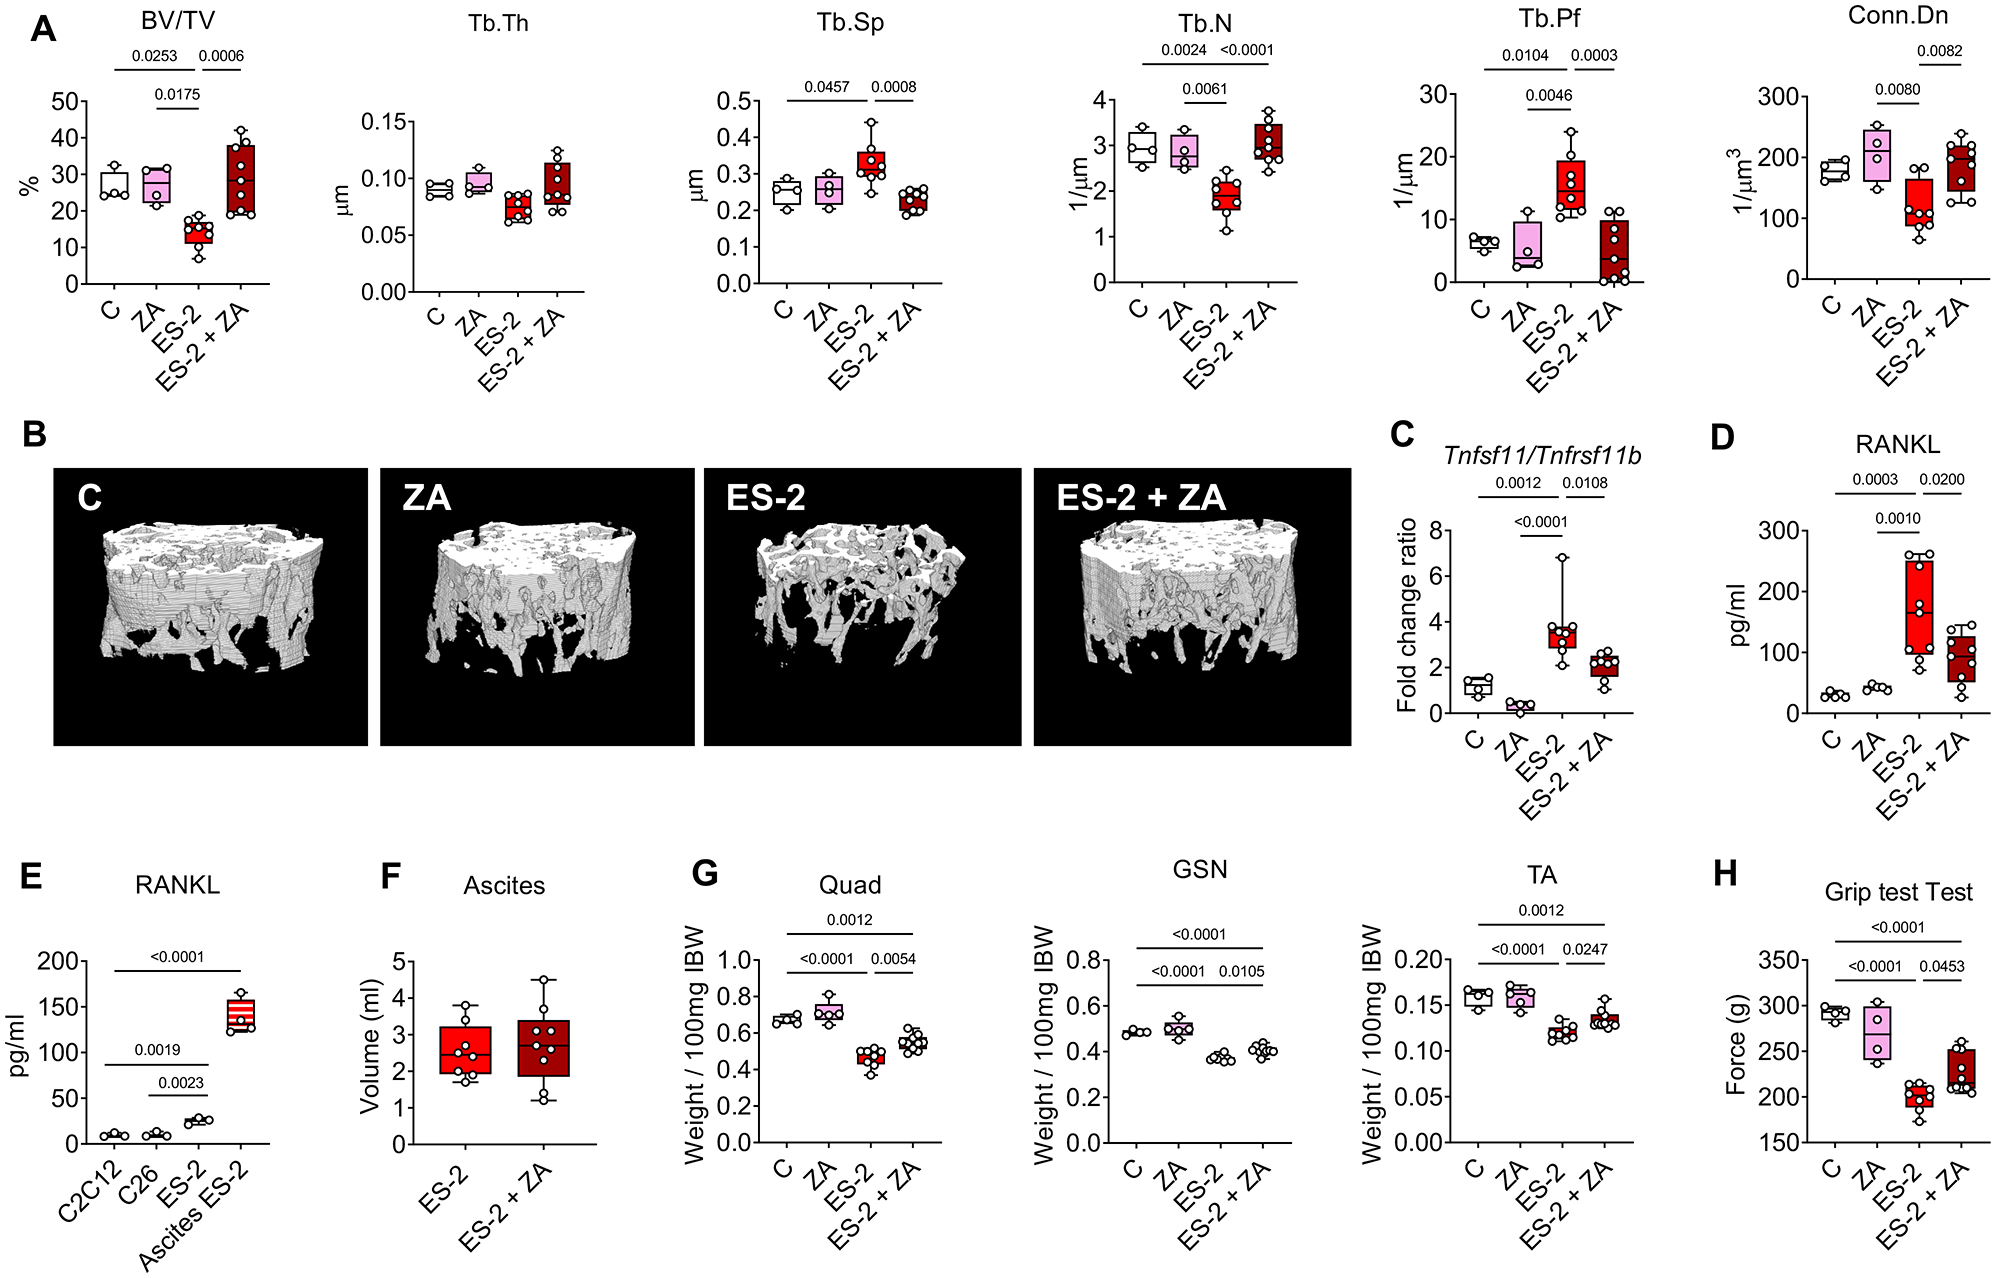
A: Assessment of trabecular bone volume fraction (BV/TV; expressed as %), trabecular thickness (Tb.Th; expressed as μm), trabecular separation (Tb.Sp; expressed as μm), trabecular number (Tb.N; expressed as 1/μm), trabecular pattern factor (Tb.Pf; expressed as 1/μm) and trabecular connectivity density (Conn.Dn; expressed as 1/μm 3) in the femurs from mice receiving vehicle (C, n=4) or zoledronic acid (ZA, n=4) and from ES-2 tumor-bearing mice (ES-2, n=8) and ES-2 hosts receiving ZA (ES-2+ZA, n=10). B: Representative microCT-based three-dimensional rendering of trabecular bone in mouse femurs. C: mRNA expression for Tnfsf11/Tnfrsf11b ratio in the marrow flushed-bones of C (n=4), ZA (n=4), ES-2 (n=8) and ES-2+ZA (n=8). Gene expression was normalized to Gapdh levels and expressed as fold change vs. vehicle (C). D: Plasma RANKL levels in C (n=5), ZA (n=5), ES-2 (n=9) and ES-2+ZA (n=9). E: RANKL levels in the conditioned medium (CM) of ES-C2C12, C26 and ES-2 cultures and in the ascites collected from ES-2 tumor-bearing mice. F: Tumor volume in ES-2 (n=8) and ES-2+ZA (n=9). G: Skeletal muscle weights in C (n=4), ZA (n=5), ES-2 (n=8) and ES-2+ZA (n=10). Muscle weight were normalized to the initial body weight (IBW) and expressed as weight/100mg IBW. H: Whole body grip strength (expressed in grams of force) in C (n=4), ZA (n=5), ES-2 (n=8) and ES-2+ZA (n=10). Data were expressed as means ± SD. Significance of the differences: *p<0.05, **p<0.01, ***p<0.001 vs. C, #p<0.05, ##p<0.01, ###p<0.001 vs. ZA, $p<0.05, $$p<0.01, $$$p<0.001 vs. ES-2 (one-way ANOVA with Tukey’s test).