
Figure 3. RANKL causes myotube atrophy, along with modulation of inflammatory signaling pathways.
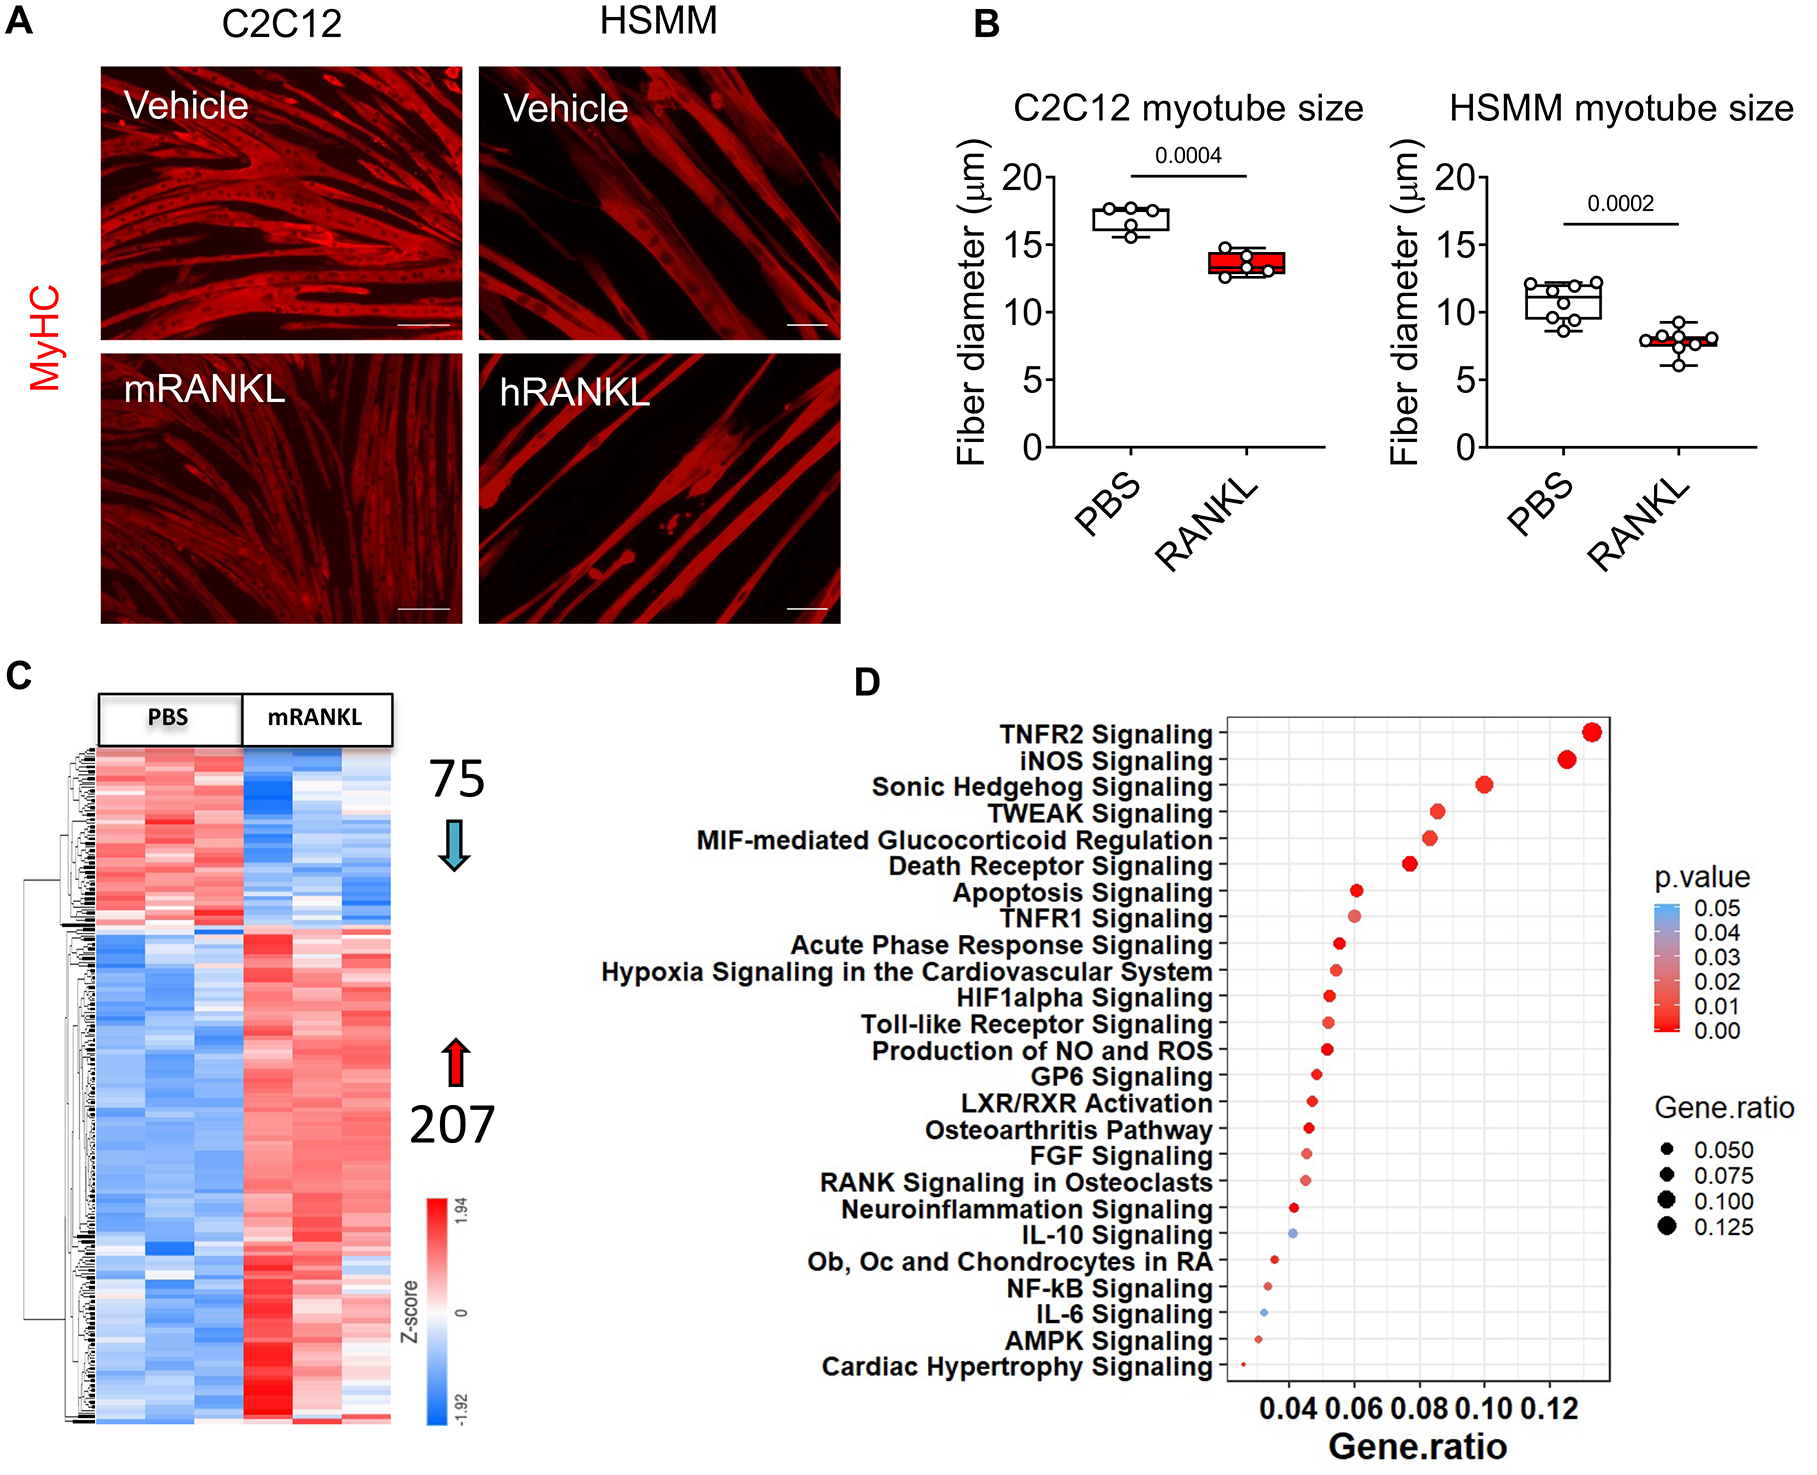
A-B: Representative images and quantification of size in murine C2C12 and human HSMM myotubes exposed to PBS or recombinant RANKL (mouse or human, respectively; 200 pg/ml) for 48h. Red staining: myosin heavy chain. Up to 400 myotubes per experimental condition were measured, in triplicate. Next-Generation RNA-Sequencing in C2C12 myotubes treated with recombinant RANKL (200 pg/ml) for 48h (n=3). C: Heatmap represents the differentially expressed genes (red= 207 genes upregulated and blue= 75 genes downregulated). D: The dot plot graph represents canonical pathways from IPA. The size of the dot represents the gene ratio, while the color indicates p-value. IPA pathway analysis using a p<0.05 discovery cutoff. Data were expressed as means ± SD. Significance of the differences *p<0.05, **p<0.01, ***p<0.001 vs. PBS (unpaired t-test).