
Figure 5. High RANKL exacerbates muscle and bone loss in murine cancer cachexia.
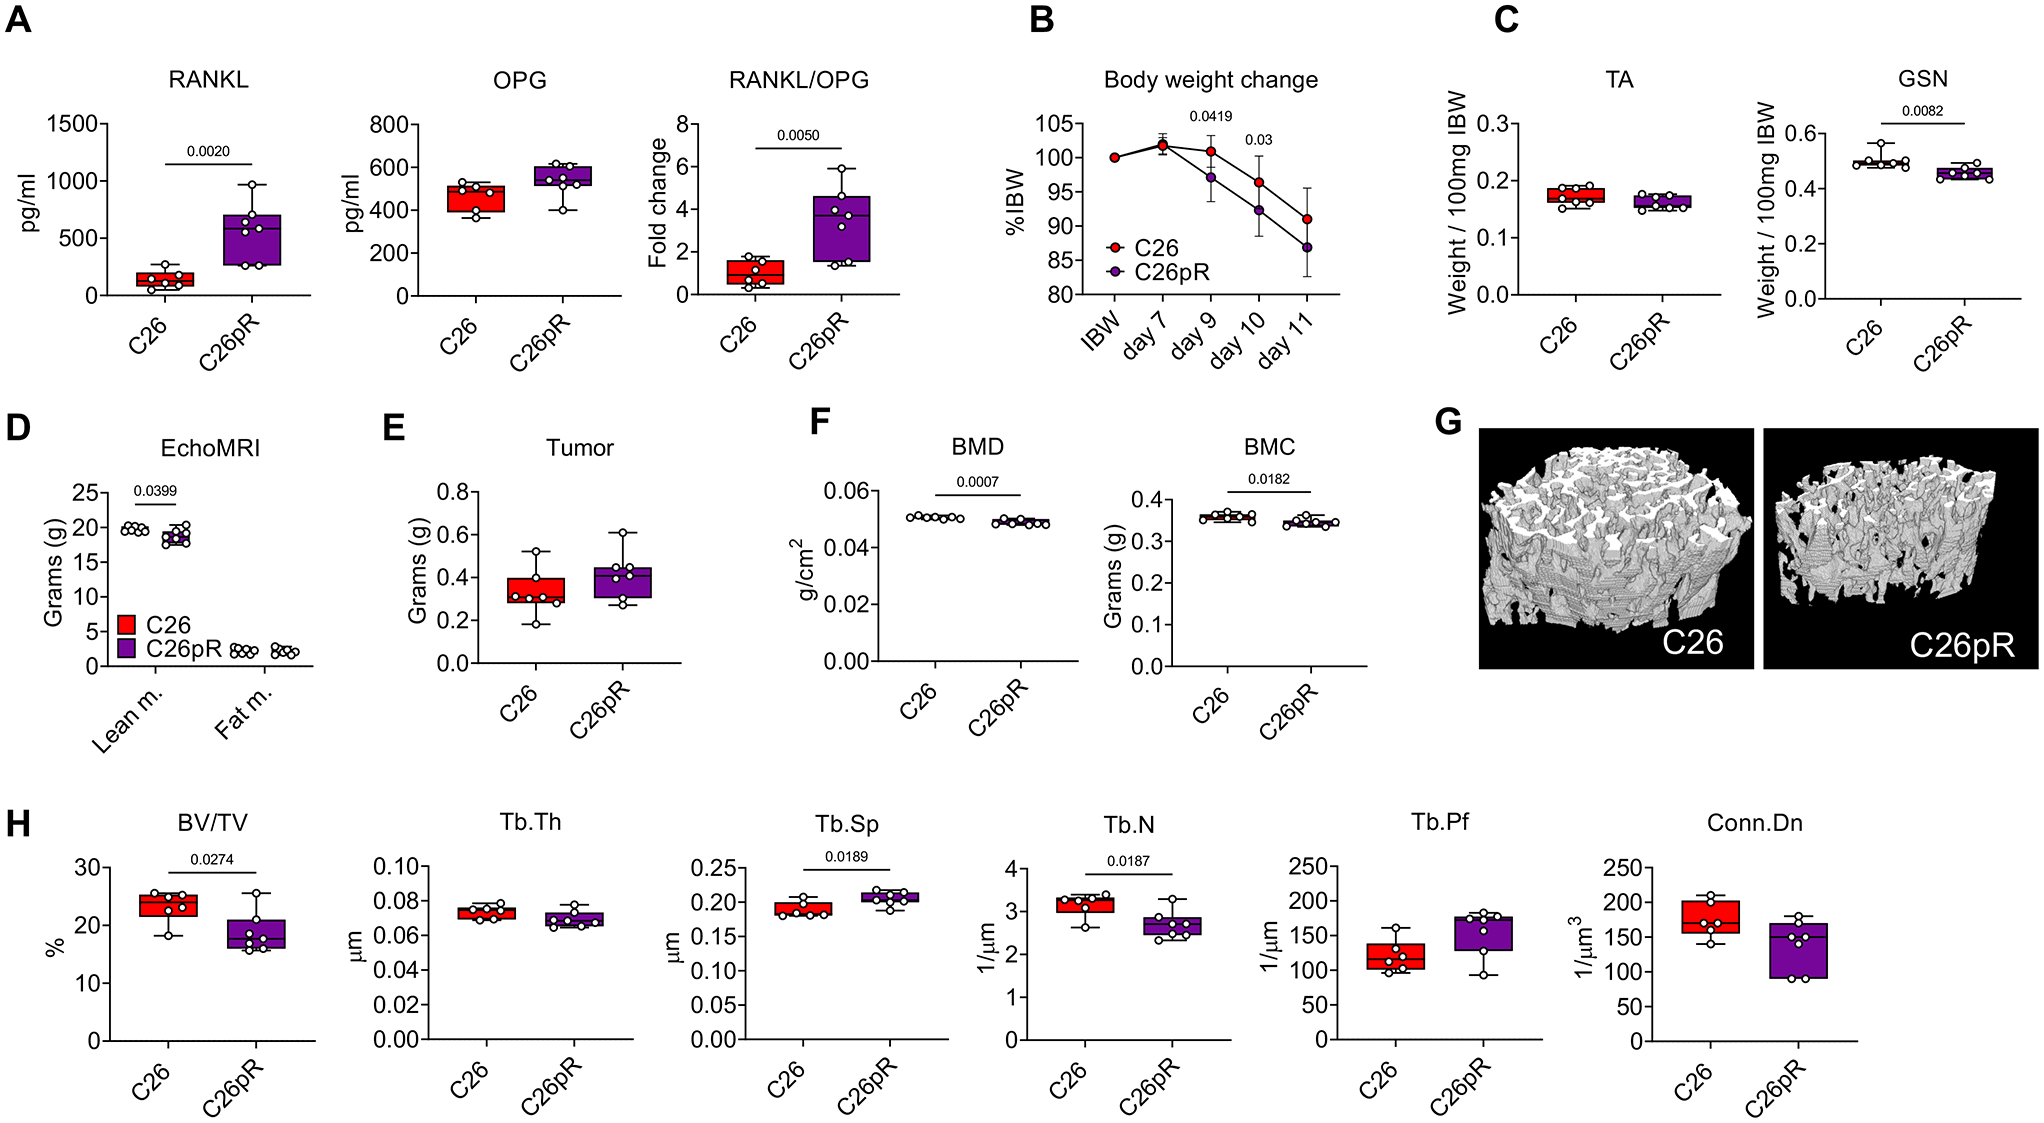
A: Plasma levels of RANKL and OPG, as well as RANKL/OPG ratio in C26 (n=6) or C26pR (n=7) barers. B: Body weight change curves during 11 days of tumor development in C26 (n=7) or C26pR (n=7) tumor-bearing mice. (two-way repeated measure ANOVA with Tukey’s test). Interaction p value: 0.1098. C: Skeletal muscle weights in tibialis anterior (TA) and gastrocnemius (GSN) muscles in C26 (n=7) or C26pR (n=7) tumor-bearing mice. Muscle weights were expressed as weight/100mg IBW. D: Lean and fat mass on the day of the sacrifice were assessed in C26 (n=7) or C26pR (n=7) tumor-bearing mice by using EchoMRI. Data (means ± SEM) are expressed in grams. E: Tumor mass in C26 (n=6) or C26pR (n=7) tumor-bearing mice. F: Changes in total bone mineral density (BMD) and bone mineral content (BMC) in C26 (n=6) or C26pR (n=7) tumor-bearing mice. Data (means ± SD) are expressed as g/cm2 (for BMD) or g (BMC). G: Representative microCT-based three-dimensional rendering of trabecular bone in femurs from C26 (n=6) or C26pR (n=6) tumor-bearing mice. H: Assessment of trabecular bone volume fraction (BV/TV; expressed as %), trabecular thickness (Tb.Th; expressed as μm), trabecular separation (Tb.Sp; expressed as μm), trabecular number (Tb.N; expressed as 1/μm), trabecular pattern factor (Tb.Pf; expressed as 1/μm) and trabecular connectivity density (Conn.Dn; expressed as 1/μm 3) in the femurs from C26 (n=6) or C26pR (n=6) tumor-bearing mice. Data (means ± SD). Significance of the differences *p<0.05, **p<0.01, ***p<0.001 vs. C26 (unpaired t-test).