
Figure 6. Anti-RANKL treatments reduce myotube atrophy induced by ES-2 cells, improve muscle mass and strength, preserve bone mass and normalize RANKL/OPG expression in the OvCa hosts.
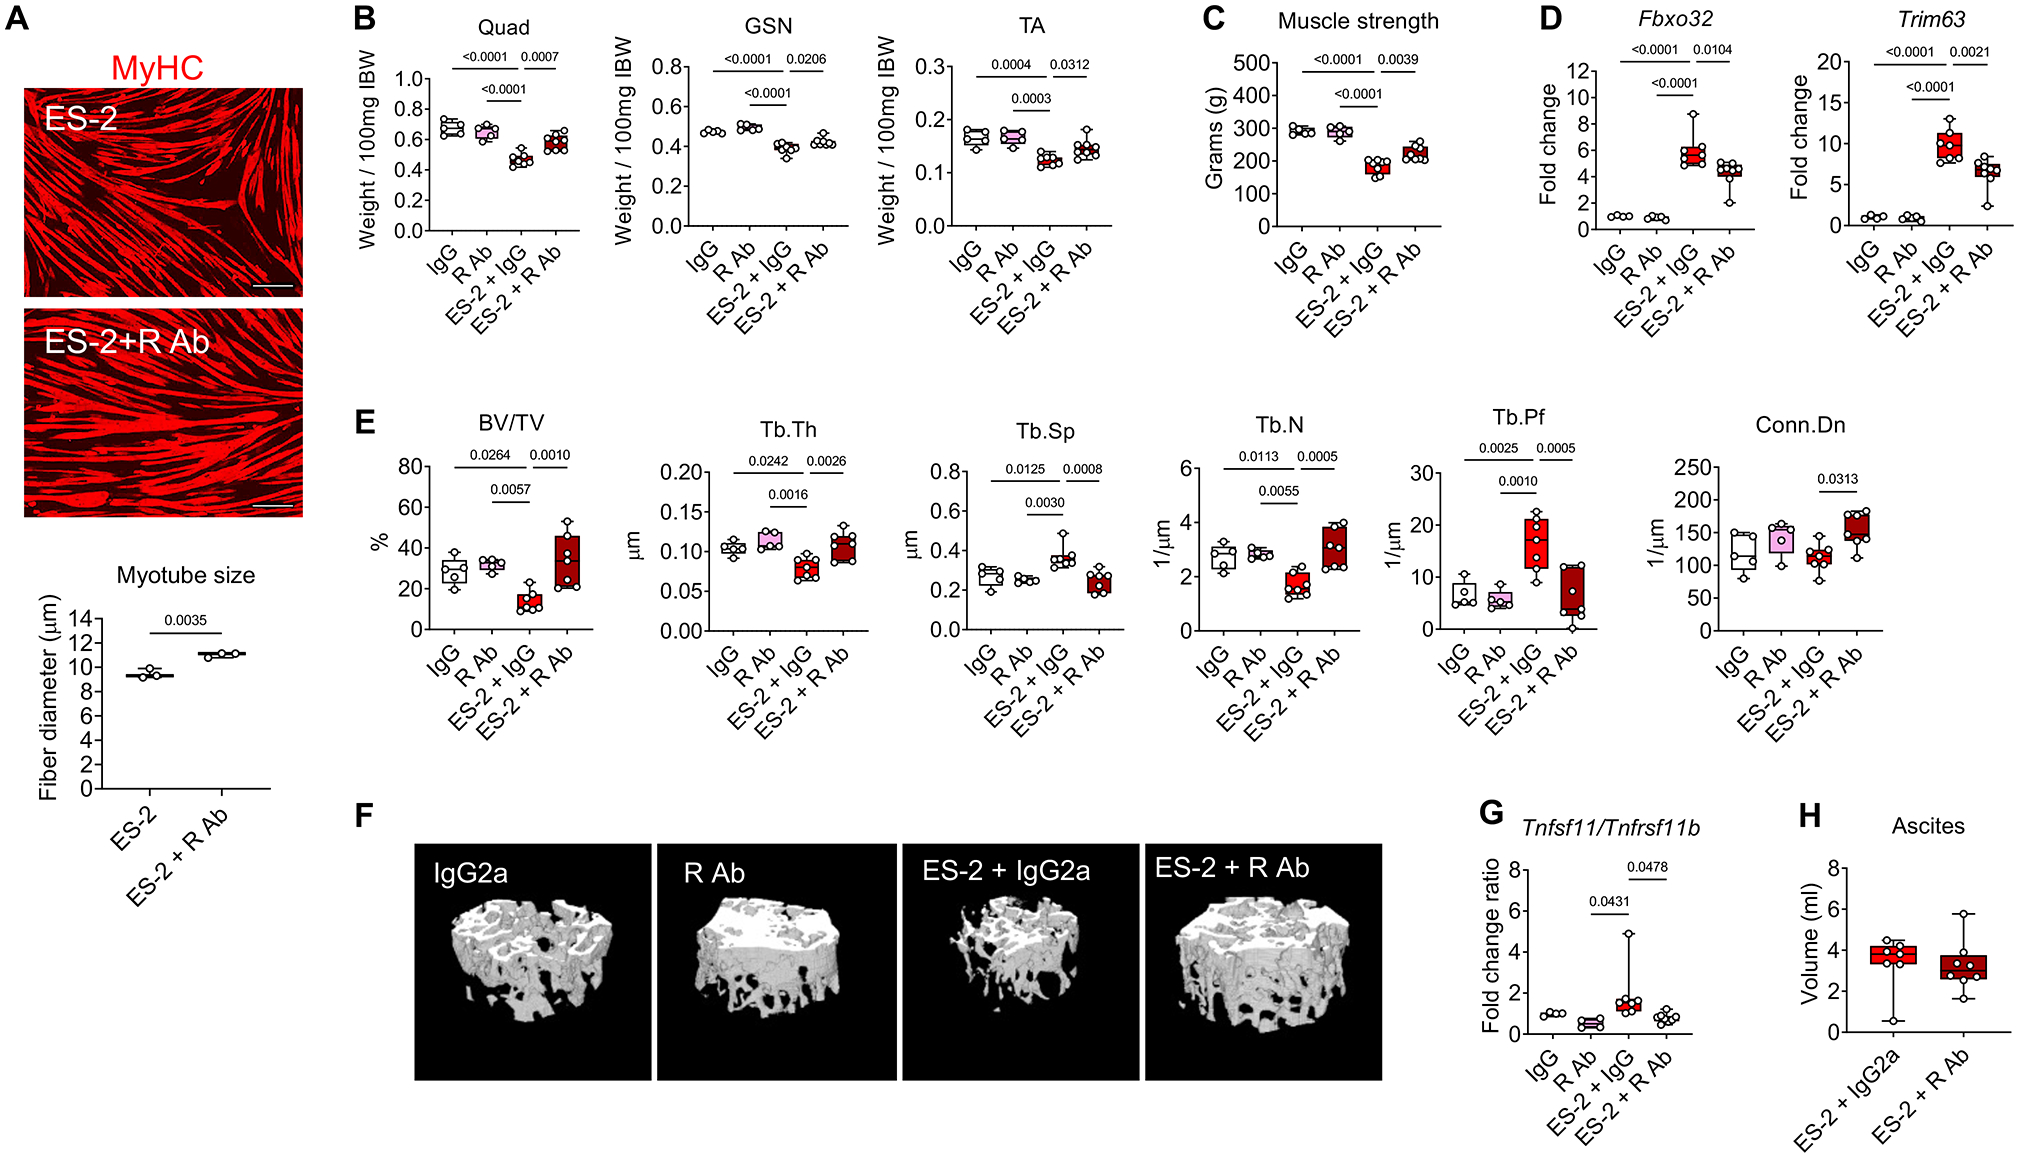
A: Representative images and quantification of C2C12 myotubes size co-cultured with ES-2 cells and exposed to anti-RANKL antibodies. Red staining: myosin heavy chain. Scale bar: 100 μm. B-C: Skeletal muscle weights and whole-body grip strength (expressed in grams) in IgG2 (n=5), R Ab (n=5), ES-2+IgG2 (n=7) or R Ab+IgG2 (n=8). Muscle weights were expressed as weight/100mg IBW. D: Gene expression levels for Fbxo32 and Trim63 (normalized to Tbpl1) in the quadriceps muscle of IgG2a (n=4), R Ab (n=5), ES-2+IgG2 (n=7) or ES-2+R Ab (n=8). Gene expression is expressed as fold change vs. IgG2a. E: Assessment of trabecular bone volume fraction (BV/TV; expressed as %), trabecular thickness (Tb.Th; expressed as μm), trabecular separation (Tb.Sp; expressed as μm), trabecular number (Tb.N; expressed as 1/μm), trabecular pattern factor (Tb.Pf; expressed as 1/μm) and trabecular connectivity density (Conn.Dn; expressed as 1/μm3) in the femurs from IgG (n=5), R Ab (n=5), ES-2+IgG2 (n=7) or ES-2+R Ab (n=7). F: Representative microCT-based three-dimensional rendering of trabecular bone in mouse femurs. G: mRNA expression levels for the Tnfsf11/Tnfrsf11b ratio in the marrow flushed-bone of IgG2a (n=4), R Ab (n=4), ES-2+IgG2 (n=7) or R Ab+IgG2 (n=8). Gene expression was normalized to Gapdh levels and expressed as fold change vs. IgG2. H: Tumor (ascites) volume in ES-2+IgG2 (n=7) or R Ab+IgG2 (n=8). Data (means ± SD). Significance of the differences: *p<0.05, **p<0.01, ***p<0.001 vs. IgG2a, ##p<0.01, ###p<0.001 vs. R Ab, $p<0.05, $$p<0.01, $$$p<0.001 vs. ES-2 (one-way ANOVA with Tukey’s test).