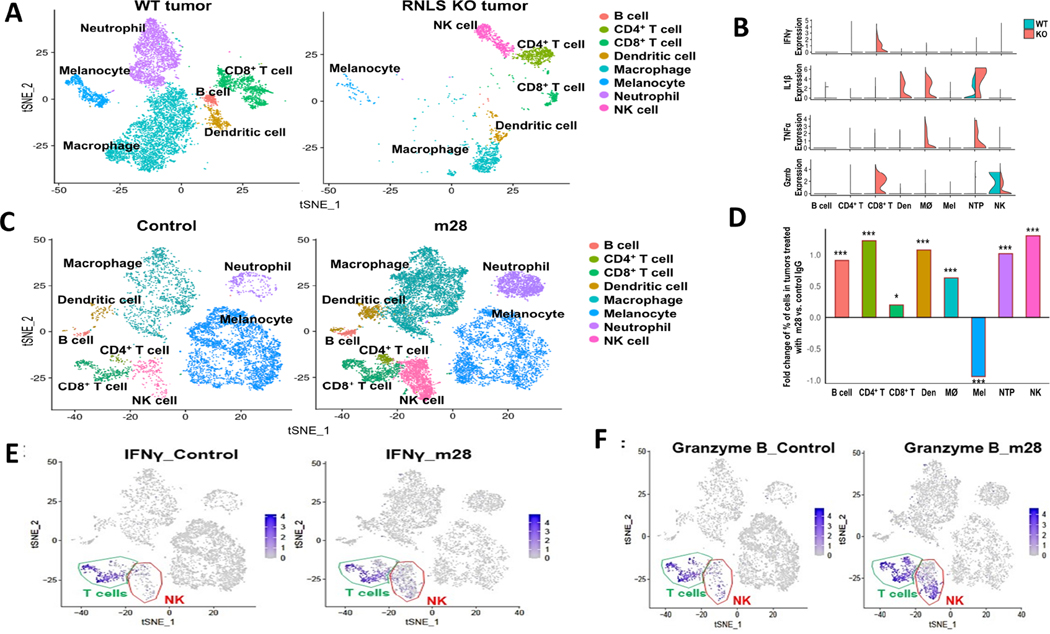
Figure 2.
Single cell RNA sequencing (scRNA-seq) of murine tumors demonstrates dramatic differences between conditions with and without RNLS. (A) B16F10 tumors from WT mice show decreased neutrophils and macrophages compared to KO mice, which have a relative abundance of NK cells, and different populations of macrophages, CD4+ and CD8+ T cells. (B) Violin plots demonstrating higher levels of granzyme B and IFNγ in CD8+ T cells in RNLS-KO mice compared to WT, increased TNFα and IL1β in macrophages and neutrophils, and activation of NK cells in RNLS-KO mice. (C-D) Treatment of WT mice bearing B16F10 tumors with m28-RNLS results in increased numbers of CD4+ and CD8+ T cells, NK cells, macrophages, neutrophils, dendritic cells (Den) and B cells. m28 treatment results in decreased numbers of melanocytes. Using the Chi-Square text, * < 5e-2, ** < 5e-3, *** < 5e-4. (E-F) tSNE plots showing that IFNγ and Granzyme B expression was primarily in T cells and increased with m28-RNLS treatment.

