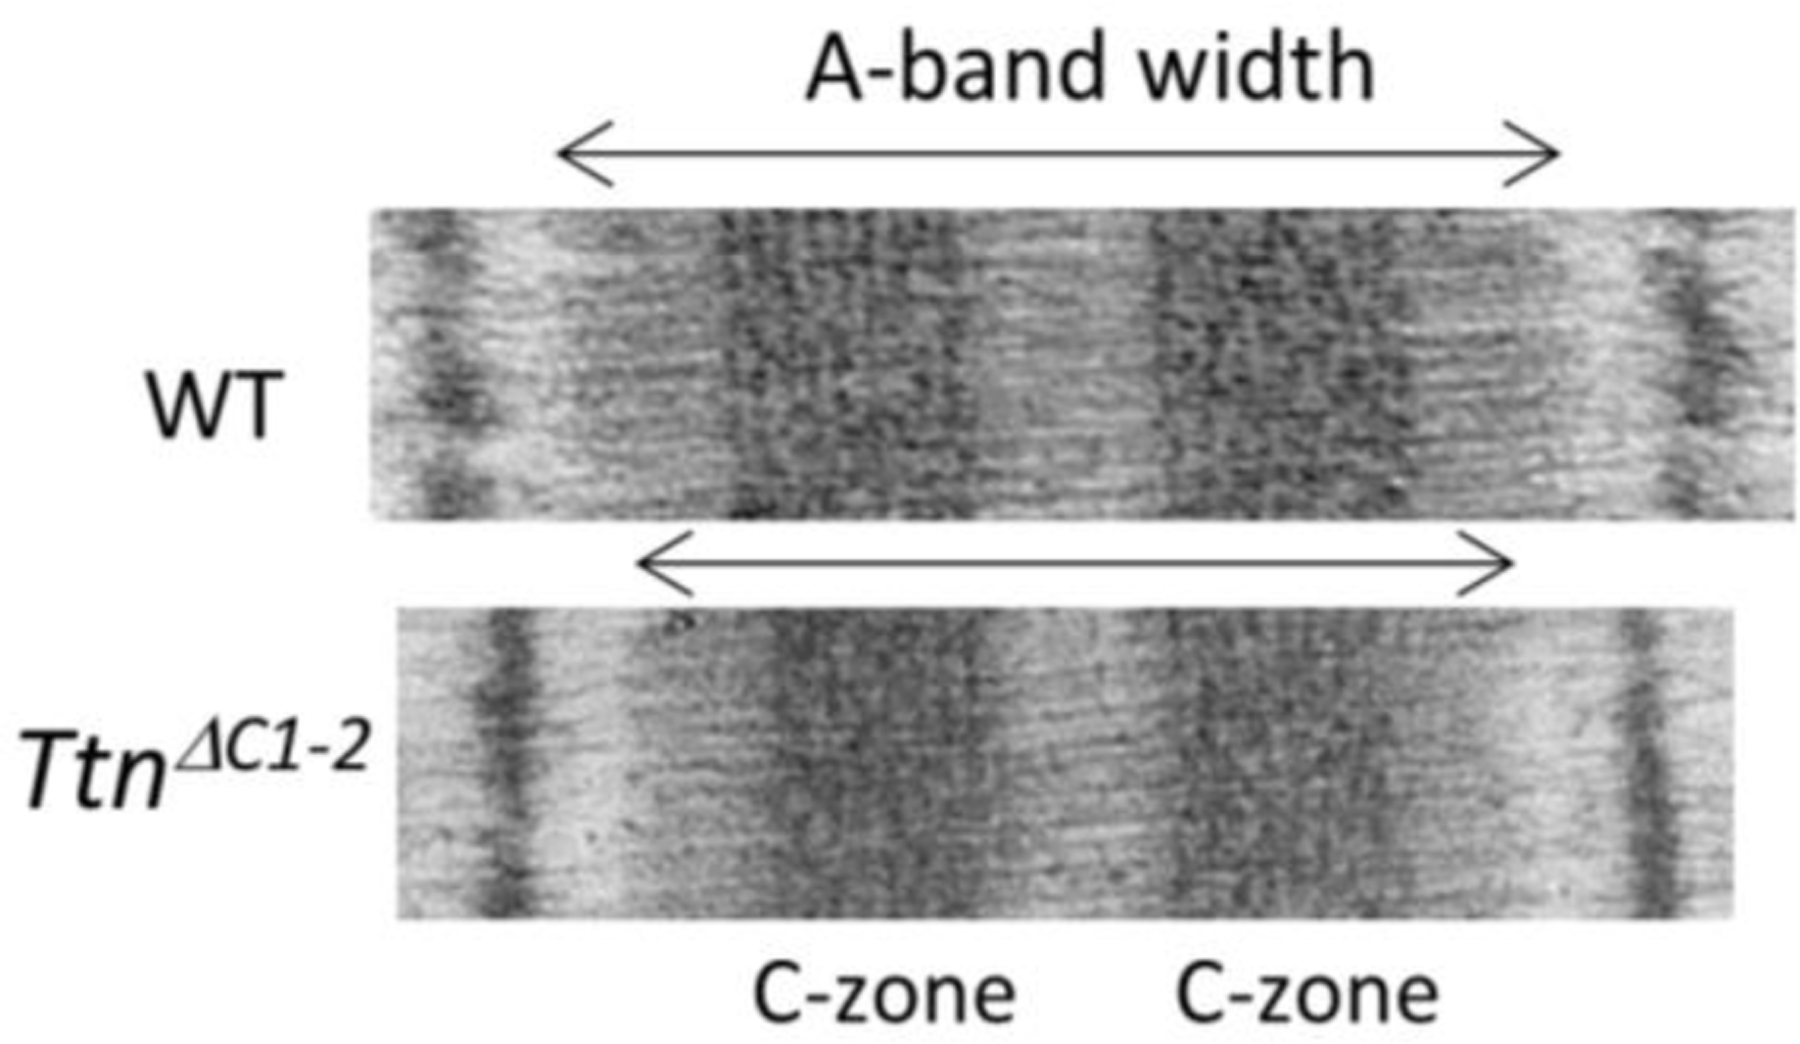
Figure 1.

Reduced A-band width in sarcomeres of TtnΔC1−2 mice. Representative electron micrographs showing that compared to WT the A-band is shorter in TtnΔC1−2 mice. By labeling the sarcomere with a cMyBP-C antibody, vertical stripes were obtained that were used to calibrate the image. Using this approach we determined that the A-band width is ~1600 nm in WT mice and ~173 nm shorter in the TtnΔC1−2 mice [9].
