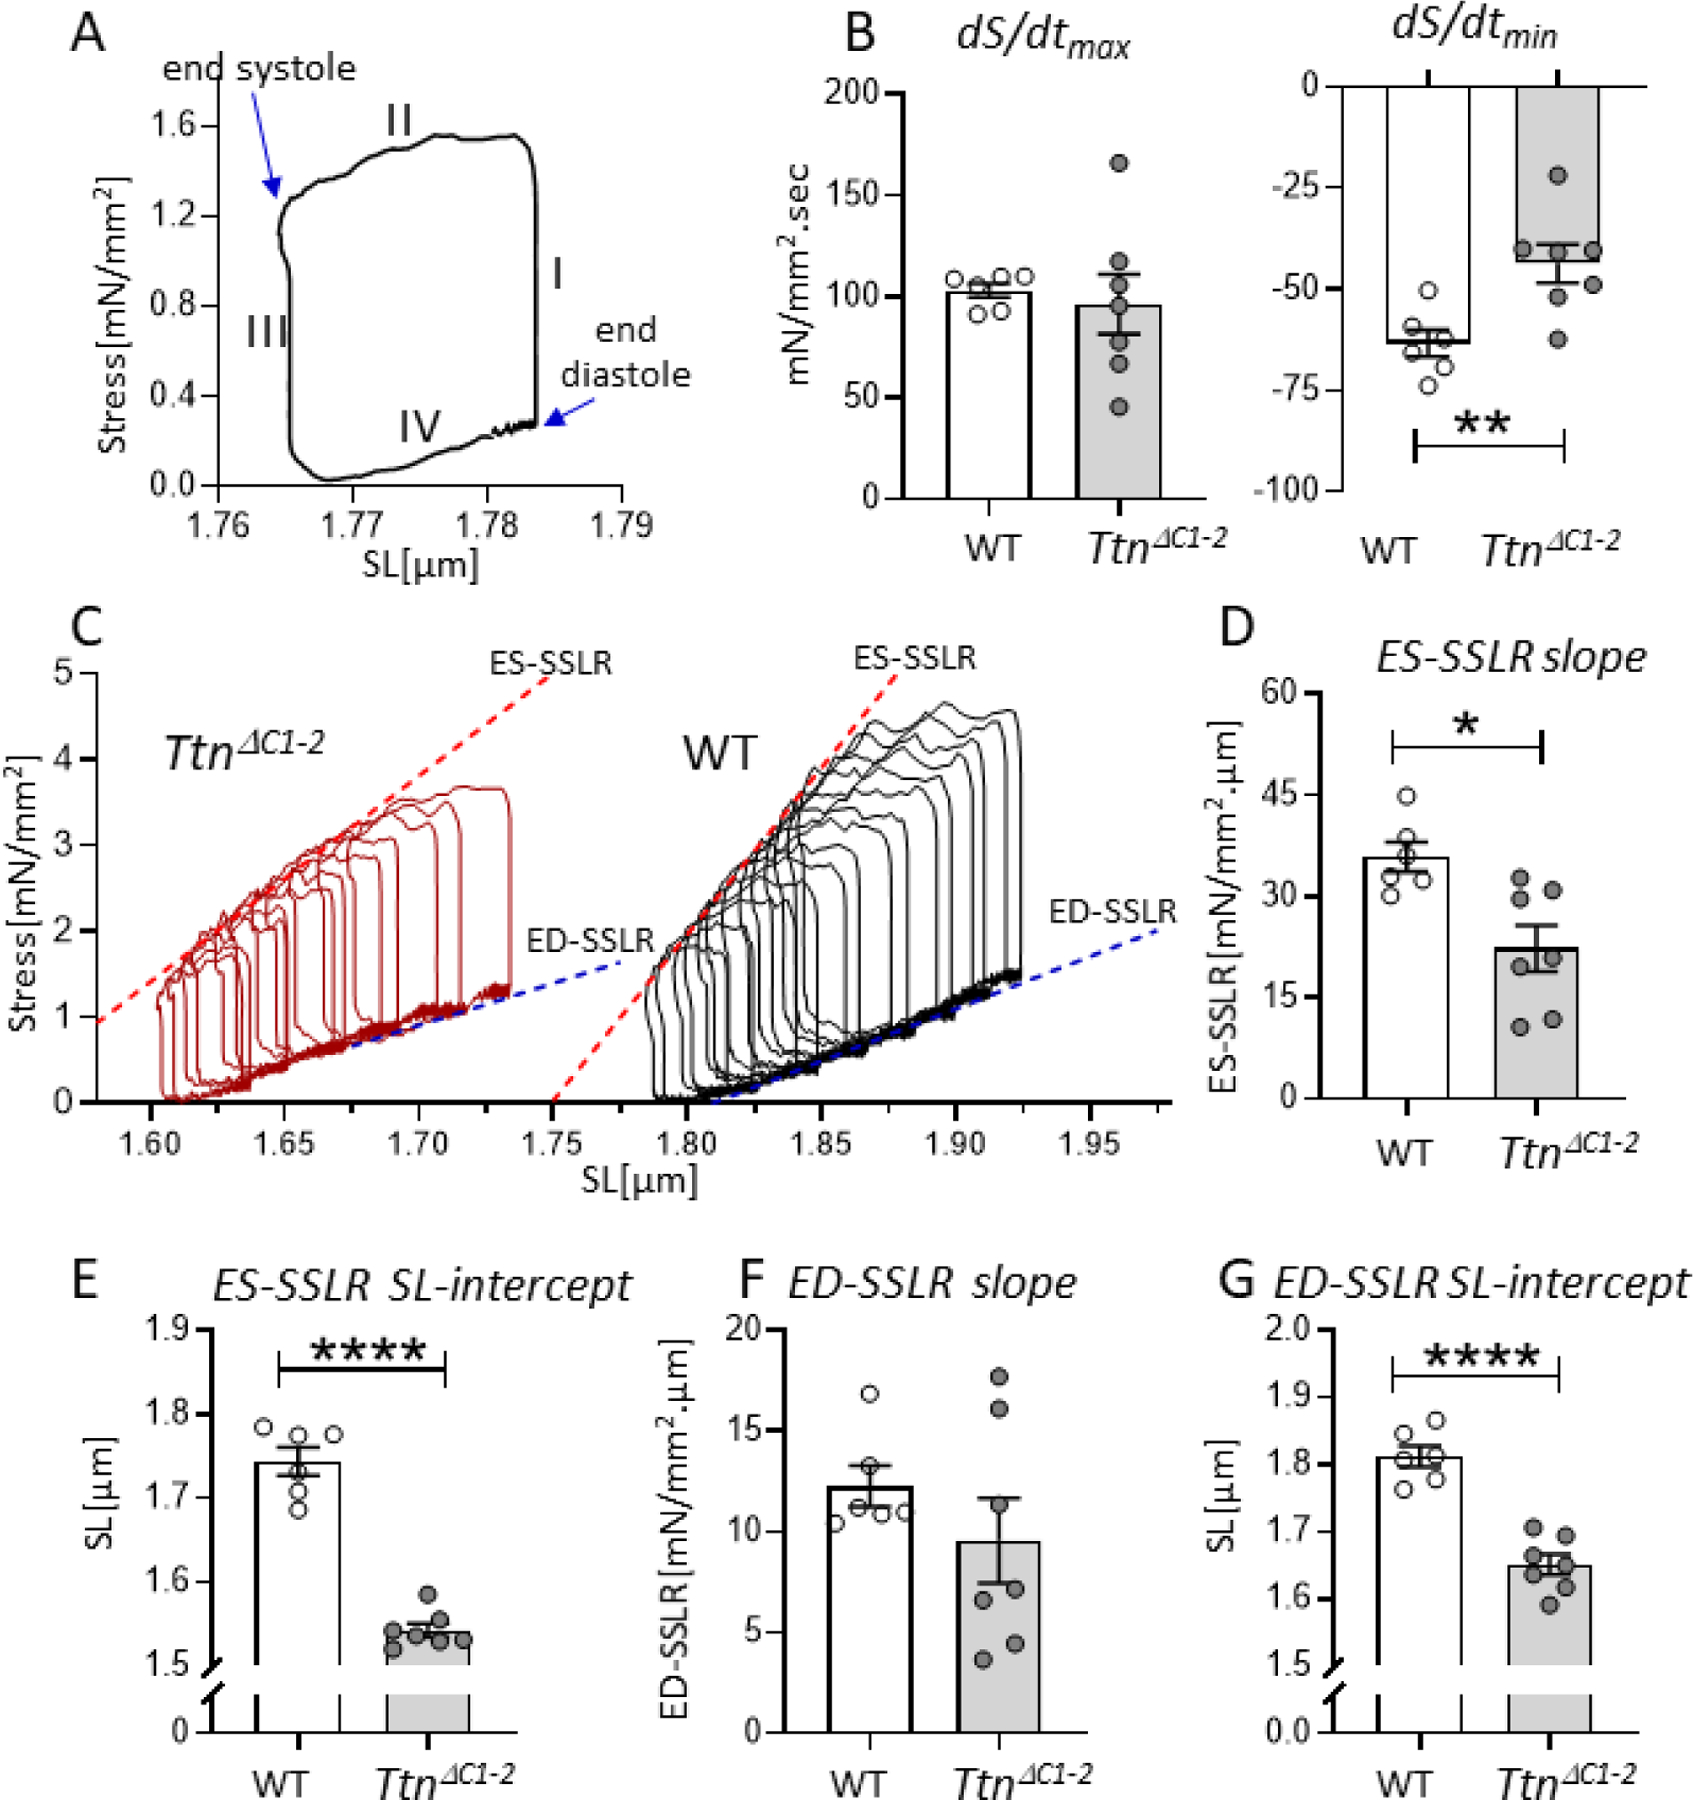
Figure 3.

Loaded intact cardiomyocyte mechanics. A) The cellular work loop example shows 4 phases that mimic isovolumic contraction (phase I), systolic ejection (II), isovolumic relaxation (III), and diastolic filling (IV) of the cardiac cycle. B) At baseline, the maximal rate of stress rise (dS/dtmax: left) during isometric contraction is not different in TtnΔC1−2 cells compared to WT. However, the maximal rate of stress decline (dS/dtmin: right) is reduced. C) Representative examples of work loop series of WT and TtnΔC1−2 cells. D) The slope of ES-SSLR, which reflects cellular contractility, is reduced in TtnΔC1−2 cells. E) The SL-intercept of the ES-SSLR is reduced. F) The slope of ED-SSLR, which reflects cellular diastolic stiffness, is not different. G) The SL-intercept of the ED-SSLR of TtnΔC1−2 is reduced. n= 6–7 mice per group, and 3–12 cells per mouse. Each data point represents the mean value of all cells of a single mouse. Mean ± S.E.M are shown in the bar graphs. Nested t-test: *P < 0.05 **P < 0.01****P < 0.0001.
