
Figure 4.
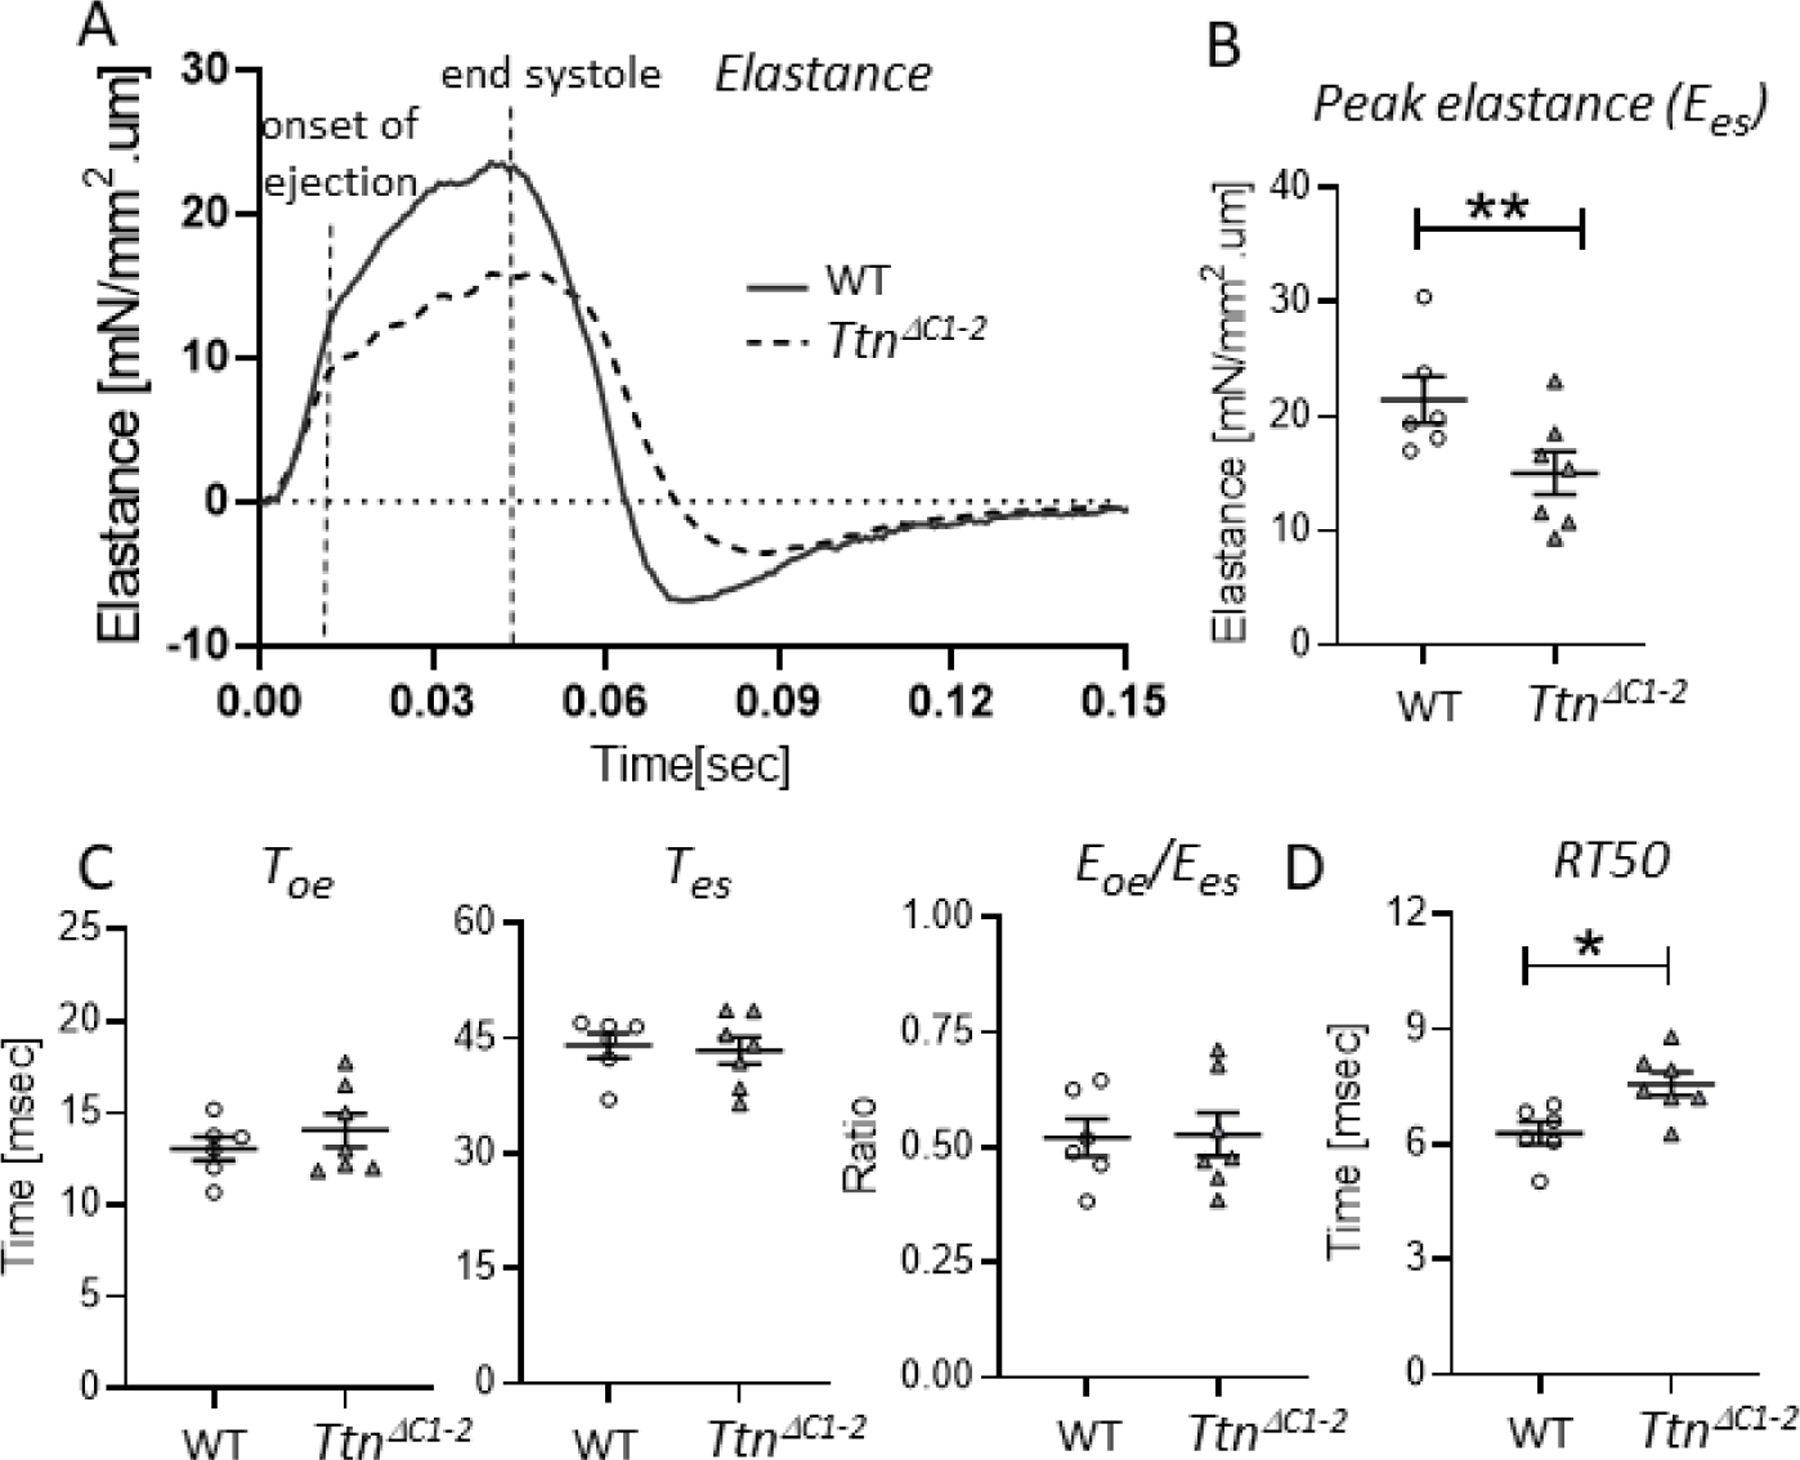
Intact cardiomyocyte time course of elastance. (A) Representative examples of an absolute time-varying elastance of WT (solid lines) and TtnΔC1−2 (broken lines) cardiomyocytes. The onset of ejection and the end-systole are indicated. B) The peak elastance at end systole (Ees) is reduced in the TtnΔC1−2 myocytes. C) The time to onset of ejection (Toe:left),the time to end systole (Tes:middle), and the ratio of elastance at the onset of ejection relative to at the end systole (Eoe/Ees:right) are not different between genotypes. D) The time to 50% elastance decay is prolonged in TtnΔC1–2. n= 6,7 mice, 3–12 cells per mouse. Each data point represents the mean value of all cells from a single mouse. Mean ± S.E.M are shown. Nested t-test: *P < 0.05 **P < 0.01.