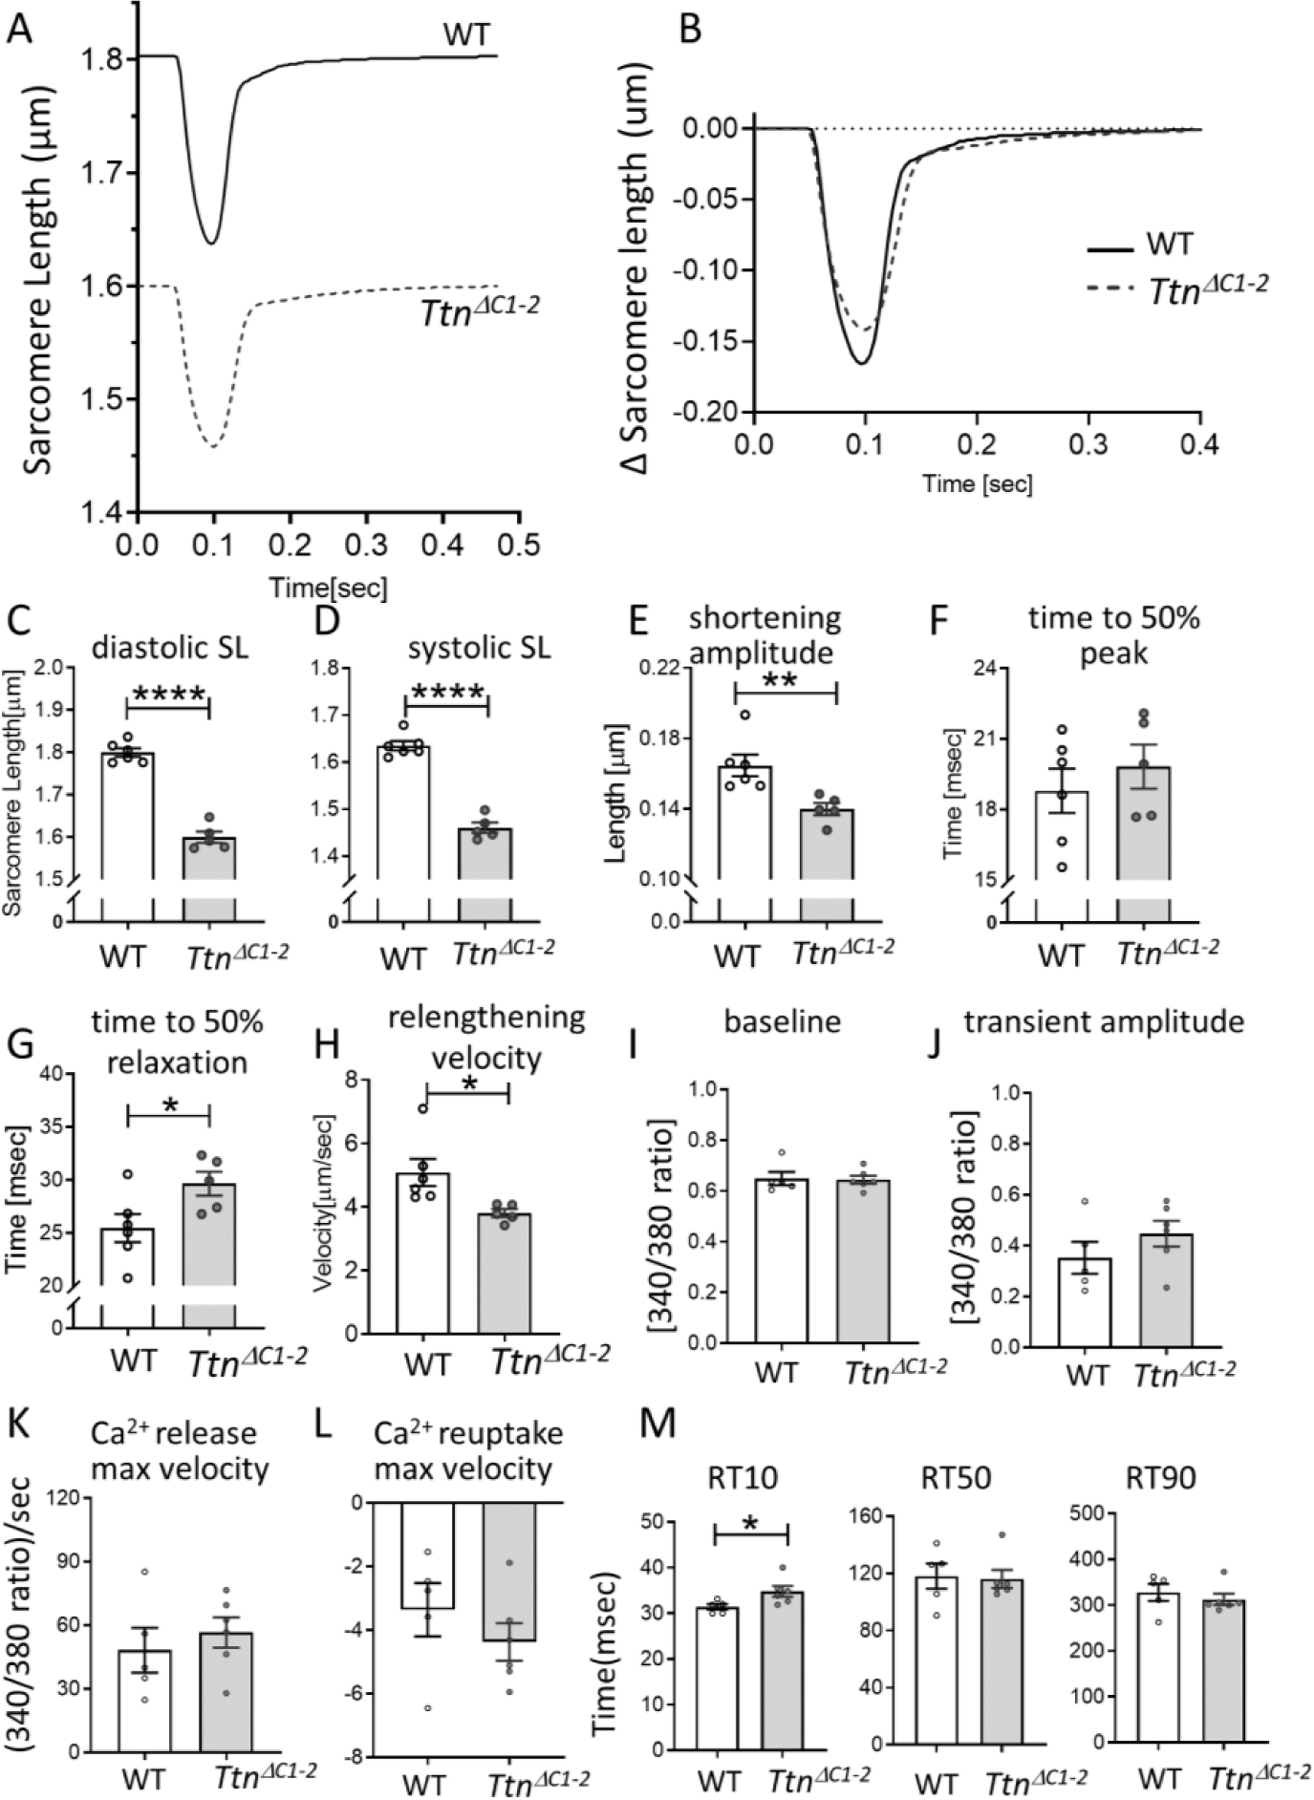
Figure 5.

Shortening-relengthening analysis and Ca2+ transients of unloaded intact cardiomyocytes. (A) Representative examples of sarcomere length (SL) shortening-relengthening traces and B) change in SL during twitch activation of WT and TtnΔC1−2 cells, stimulated at 2 Hz, C) Diastolic SL, D) systolic SL, and E) shortening amplitude are all reduced in TtnΔC1−2 cells. F) The time to 50% of peak shortening is not different. G) The time from peak to 50% relaxation is prolonged, and H) the relenghtening velocity is reduced in TtnΔC1−2 myocytes. n= 5–6 mice per group, and 10–20 cells per mouse. I-M, Ca2+ transient of isolated intact cardiomyocytes, measured with Fura-2 340/380 signal. I) Diastolic baseline signal, J) transient amplitude, K) maximal velocity of rising phase of the transient, and L) maximal velocity of Ca2+ reuptake are not different between WT and TtnΔC1–2. M) The time from peak transient to 10%, 50% and 90% signal decay shows that RT10 is prolonged in TtnΔC1−2 cells, however, RT50 and RT90 are not different from WT. n= 5–6 mice per group, and 50–75 cells per mouse. Each data point represents the mean value of all cells from a single mouse. Mean ± S.E.M are shown in the bar graphs. Nested t-test: *P < 0.05 **P < 0.01 ****P < 0.0001.
