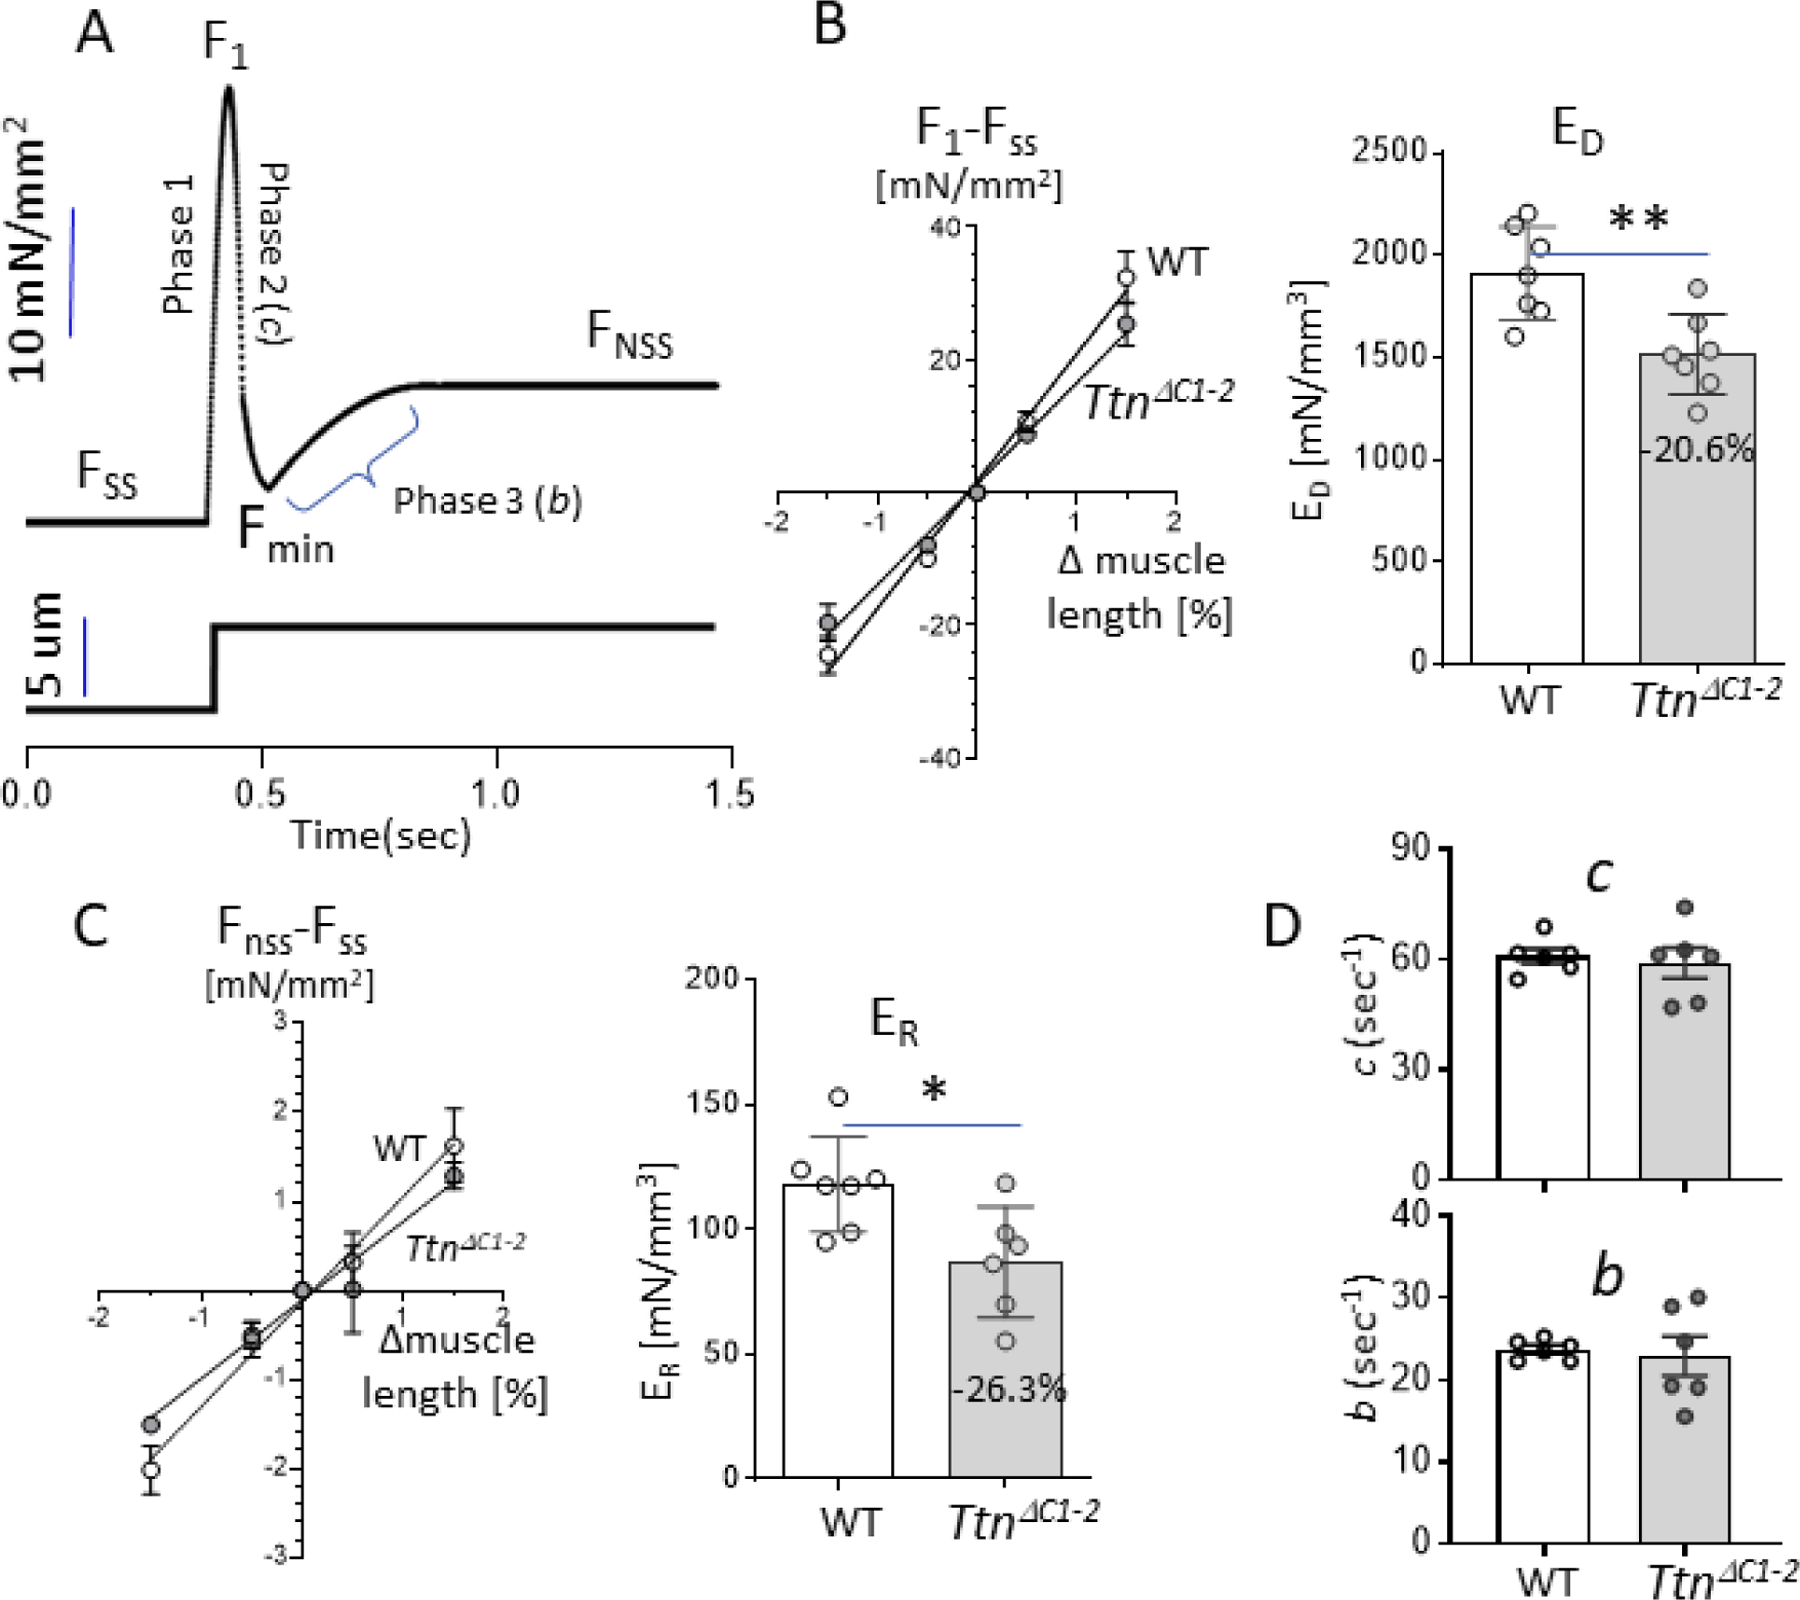
Figure 7.

Step response analysis. (A) A schematic diagram describing the features of the force response to a small amplitude step length change imposed on a maximally activated papillary muscle. See text for technical details. B) Left: magnitude of the change in force during the step (F1-Fss) vs. the amplitude of the step (% muscle length change) can be fit with a linear regression line (R2 0.99). Right: the slope of the linear regression fit is reduced in TtnΔC1−2 mice. C) Left: magnitude of the change in steady-state force (FNSS-Fss) vs. the amplitude of the step (% muscle length change) can be fit with a linear regression line (R2 0.99). Right: the slope of the linear fit is reduced in the TtnΔC1−2 mice. D) The rate of cross-bridge detachment (c; top) and the rate of cross-bridge recruitment (b; bottom) are unchanged in the TtnΔC1−2 mice. n=7 mice per group, 2 preparations per mouse. Each data point represents the mean value of all muscle strips from a single mouse. Bar graphs show the mean ± S.E.M. Mann-Whitney test, *P < 0.05 ***P < 0.001 ****P < 0.0001.
