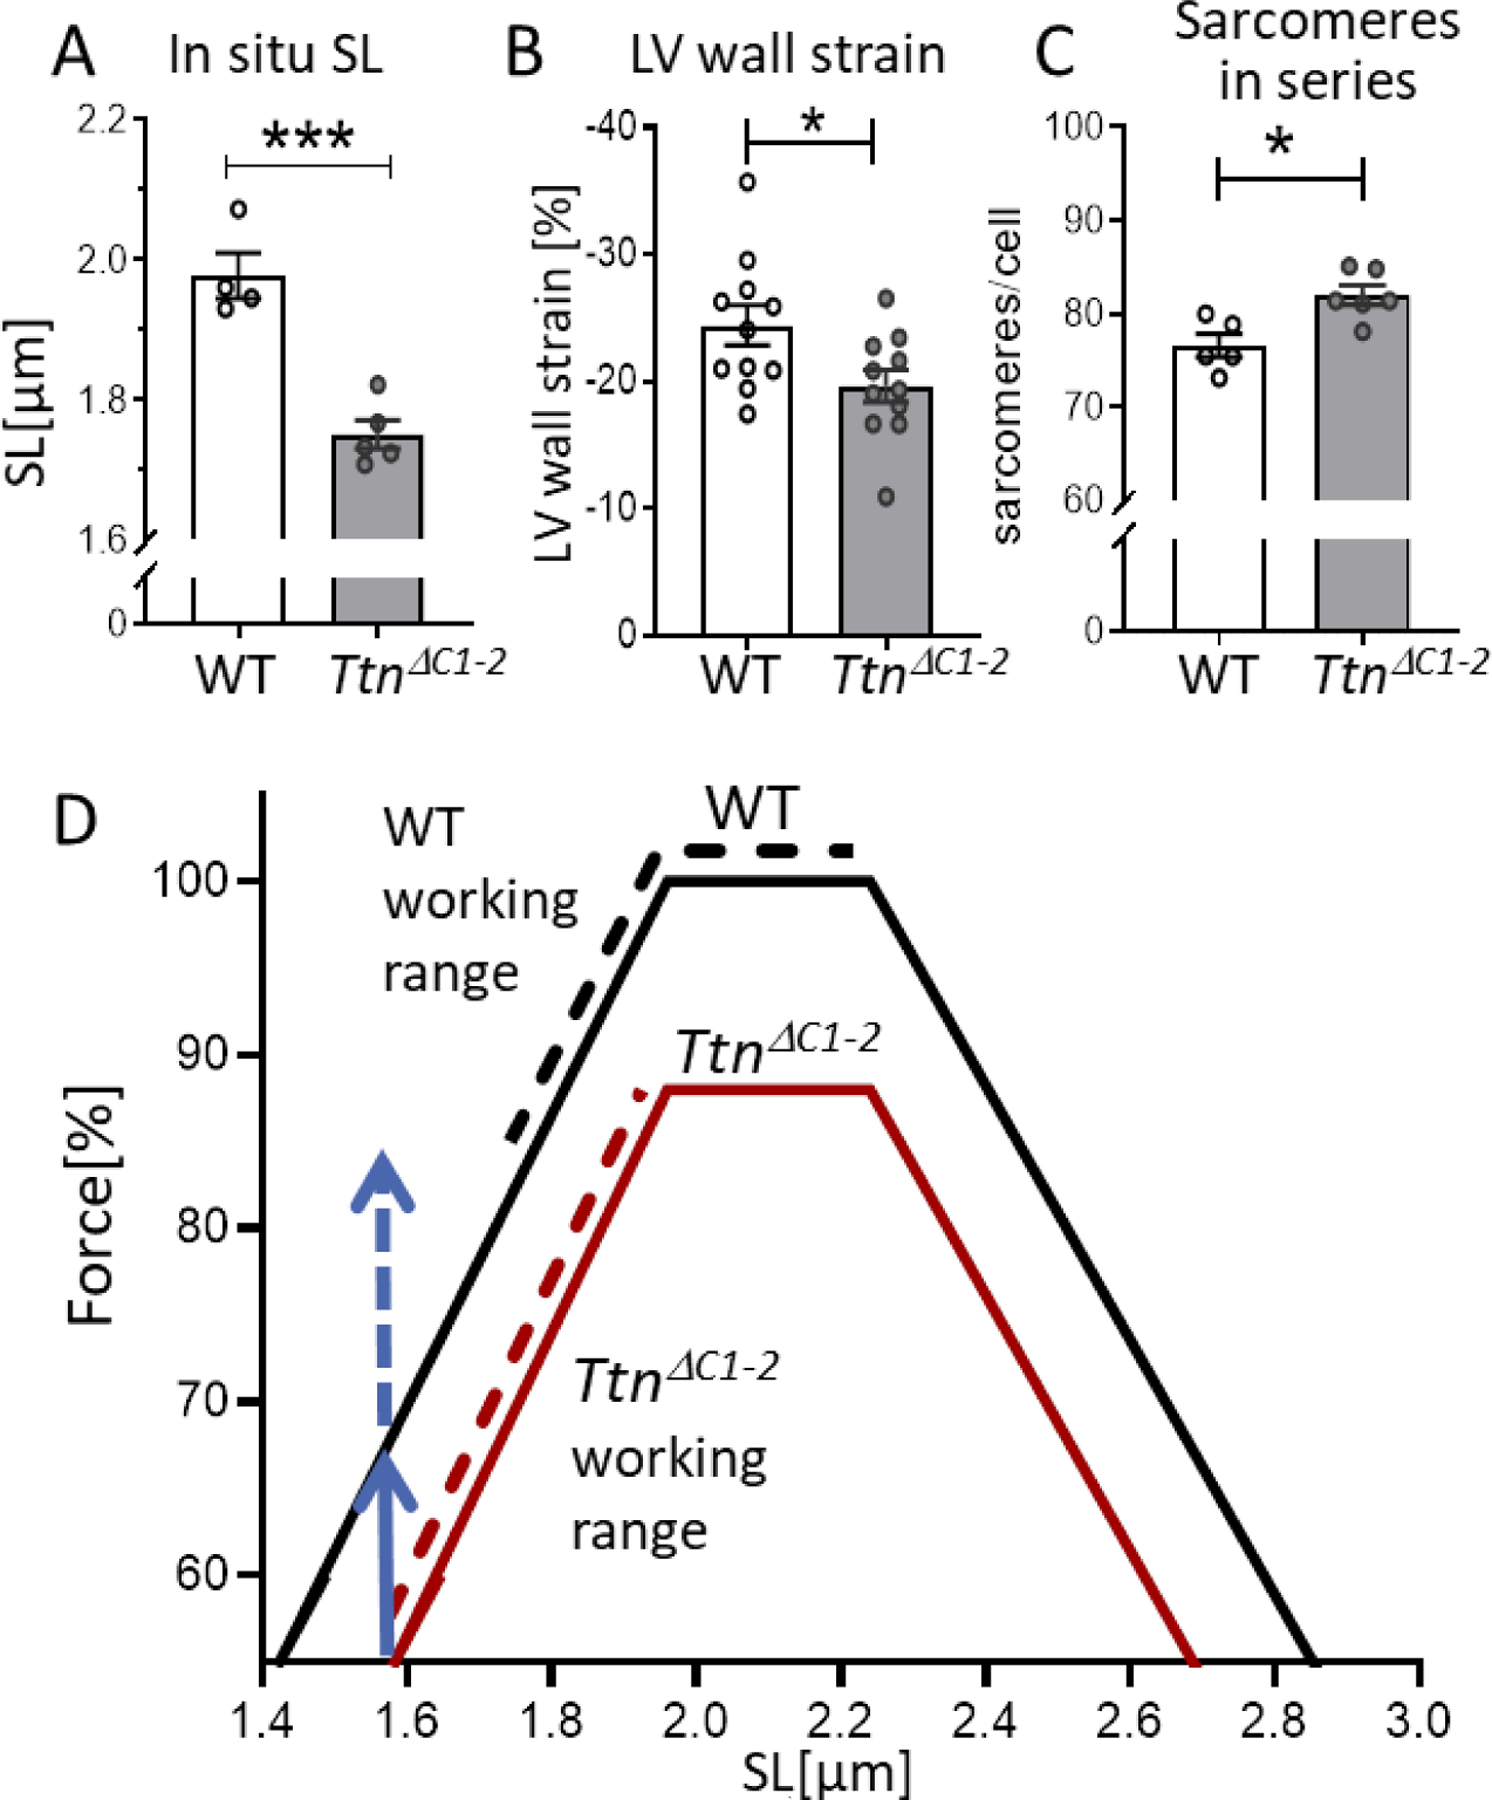
Figure 8.

In situ diastolic SL and predicted operating SL ranges (A) The in situ diastolic SLs of the LV mid-wall at Veq is shorter in TtnΔC1−2 hearts. B) The LV circumferential wall strain measured by echocardiography. C) The number of sarcomeres in series per cell is increased in TtnΔC1–2. D) The predicted force–SL relations (solid lines), and the predicted operating SL ranges (broken lines). The vertical blue arrows indicate the predicted force reduction due to the shorter thick filaments (solid blue) and due to the shorter end-systolic SL (broken blue line). See text for details. n= 4–5 mice per group, 80–100 measurements per mouse for A. n=11 mice per group for B. n= 5–6 mice per group, and 50–75 cells per mouse for C. Each data point in A and C represents the mean values of all measurements from a single mouse. Mean ± S.E.M are shown in the bar graphs. Mann-Whitney test, *P < 0.05 ***P < 0.001.
