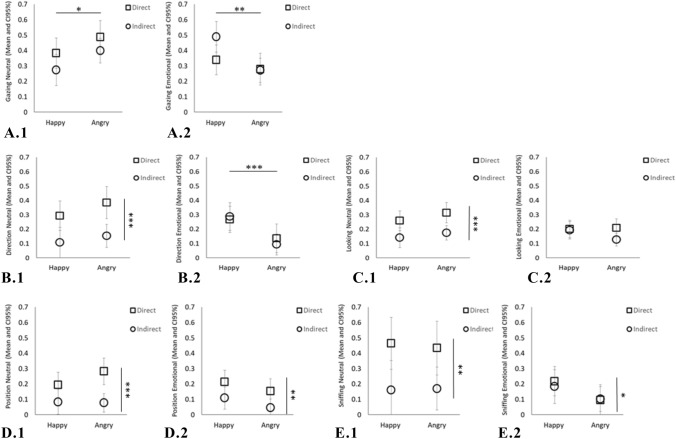
Fig. 2.
Relationship between dog behaviour towards the different actors (neutral actor—graphs 0.1 or the emotional actor—graphs 0.2), emotional condition (happy or angry) and food accessibility (direct or indirect). Within each graph, the Y-axis refers to the behavioural category and the X-axis refers to the emotional condition (positive on the left, i.e. happy, and negative on the right, i.e. angry). Results are presented as mean relative duration with 95% confidence interval for gazing (A), body orientation—“direction” (B), looking (C), position in the room—“position” (D) and sniffing (E). We found no significant interactions between factors. The horizontal and vertical bars indicate where significant effects were found: *p ≤ 0.05; **p ≤ 0.01; ***p ≤ 0.001

