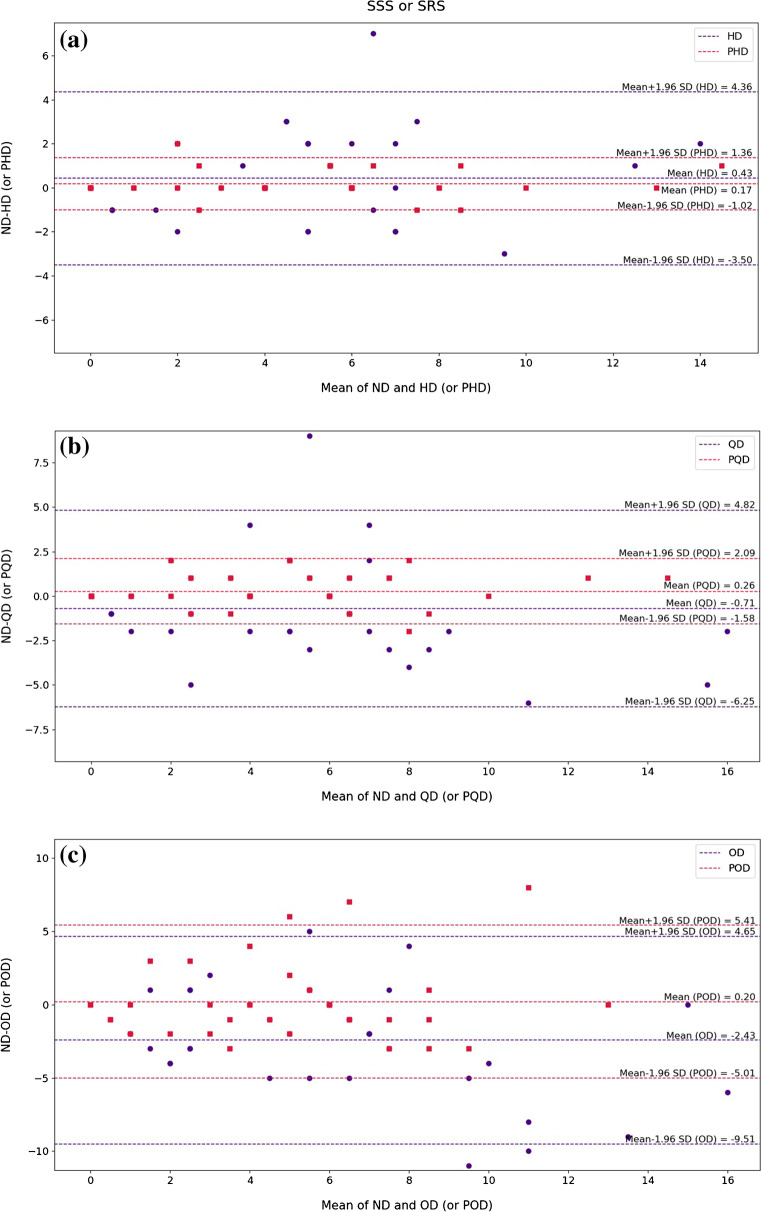
Fig. 6.
Bland–Altman plots of SSS index for the low-dose and predicted standard-dose images at a half-dose, b quarter-dose level, and c one-eighth-dose levels compared with the reference standard-dose images. The blue and red dashed lines indicate the mean and 95% confidence interval of the SSS differences in the low-dose and predicted standard-dose images, respectively. HD, half-dose; PHD, predicted half-dose; QD, quarter-dose; PQD, predicted quarter-dose; OD, one-eighth-dose; POD, predicted one-eighth-dose

