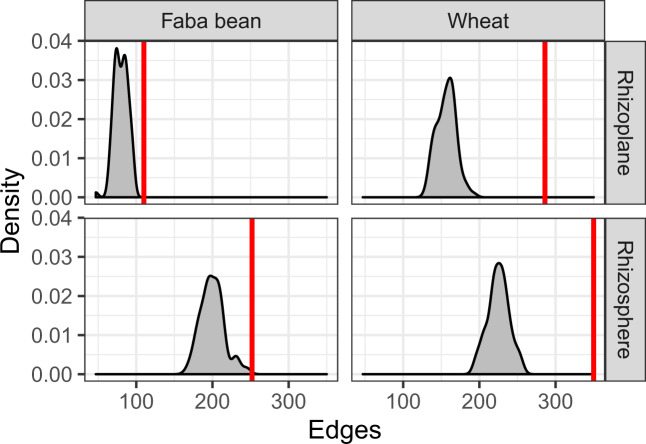
Fig. 4. Non-random co-occurrences are prevalent within bacterial communities associated with the rhizosphere and rhizoplane of wheat and faba bean crops.
The x-axis shows the number of edges (connections in networks). The red line is the number of edges in the observed networks. The gray density plot is the distribution of edges from null models. There are more edges in the real observed networks than that of the null models, indicating that the patterns of co-occurrence and co-exclusion within each network are not random.

