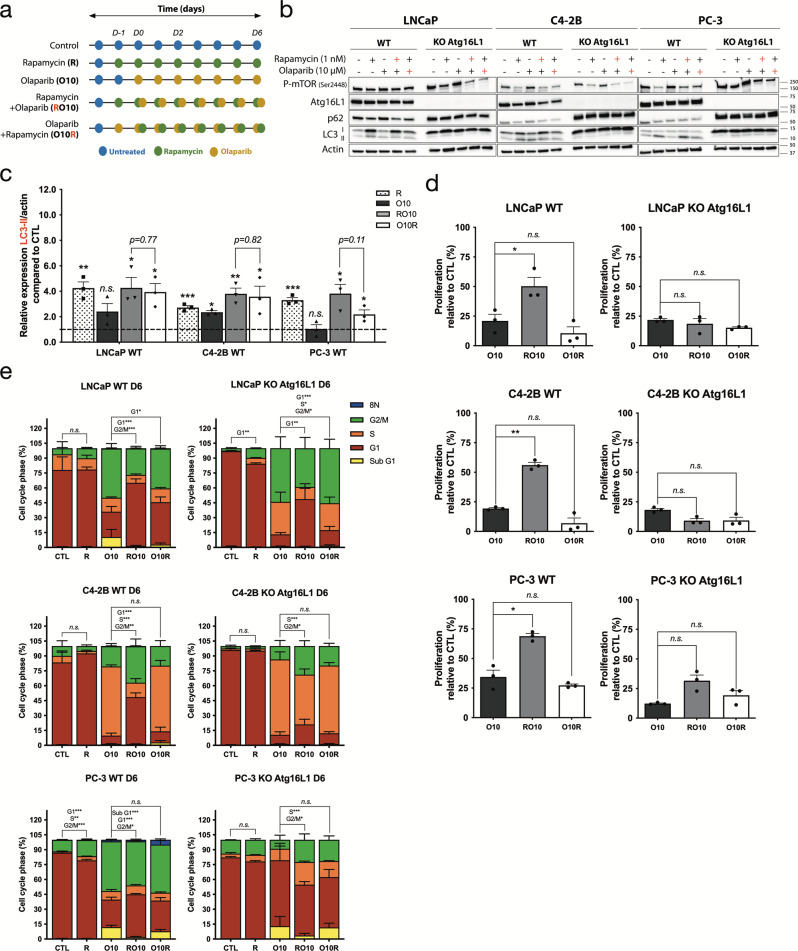
Fig. 2. Pre-activation of autophagy by rapamycin induces a protective effect against olaparib.
a Treatment timeline of cell lines. Cells were treated with 10 µM olaparib alone (denoted as O10) or received 1 nM rapamycin 24 h before (RO10) or 24 h after (O10R) the start of olaparib treatment. Experiments were conducted for 6 days. b Western blot analyses of autophagy induction after olaparib and rapamycin treatments in WT and KO Atg16L1 cell lines at day 2. Rapamycin (red +) denotes RO10. Olaparib (red +) denotes O10R. c Relative expression of LC3-II normalized with actin and compared to control (CTL) from b. d Cell proliferation of WT and KO cell lines under O10, RO10, or O10R treatments at day 6. e Quantification of cell cycle phase populations determined by flow cytometry following 6 days of treatment of WT and KO cell lines. For all data, the mean ± SEM of three independent experiments is shown. Data were analyzed using the two-tail Student t-test. n.s. = nonsignificant. *p < 0.05, **p < 0.01, and ***p < 0.001.

