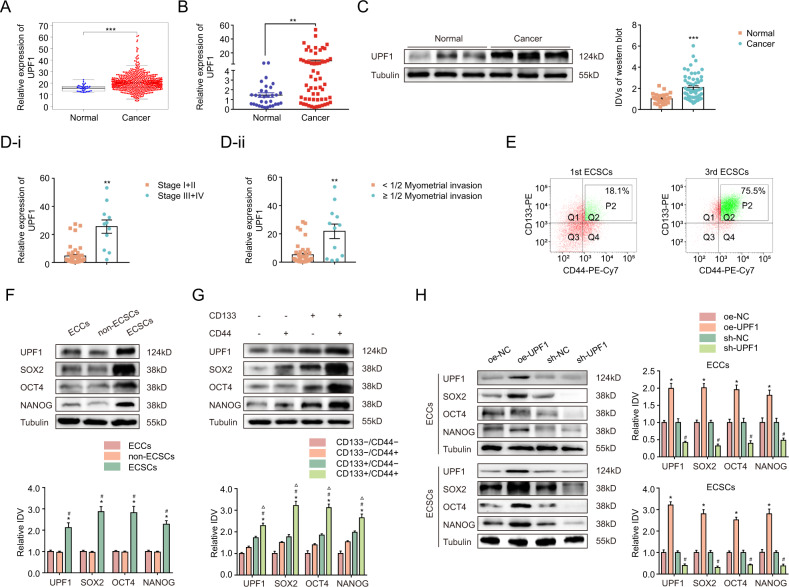
Fig. 1. UPF1 is upregulated in EC tissues and functioned as a signature gene of ECSCs.
A UPF1 expression levels in EC tissues (N = 546) and normal tissues (n = 33) in the TCGA cohort. B UPF1 expression levels in EC tissues (n = 58) compared to normal tissues (n = 32) detected using qRT-PCR. Data are presented as the means ± SEM, **P < 0.01. C UPF1 expression levels in EC tissues (n = 58) compared to normal tissues (n = 32) detected using western blotting. Data are presented as the means ± SEM, ***P < 0.001. D UPF1 expression levels in patients with different (D-i) tumor stages and (D-ii) myometrial invasion in EC tissues (n = 58) compared to normal tissues (n = 32). Data are presented as the means ± SEM, **P < 0.01. E Flow cytometry analysis of CD133+/CD44+ cells sorted from the 1st and 3rd ECSCs. F The expression of UPF1, SOX2, OCT4, and NANOG in ECCs, non-ECSCs, and ECSCs detected using western blotting. The results are presented as the ratio of the integrated density values of UPF1, SOX2, OCT4, and NANOG versus Tubulin. The graphs represent the alteration in relation to ECCs (protein of interest/Tubulin equal to 1). Data are presented as the means ± SEM (n = 3, each group), *P < 0.05 vs. ECCs group, #P < 0.05 vs. non-ECSCs group. G The expression of UPF1, SOX2, OCT4, and NANOG in CD133−/CD44−, CD133−/CD44+, CD133+/CD44−, and CD133+/CD44+ cells detected using western blotting. The results are presented as the ratio of the integrated density values of UPF1, SOX2, OCT4, and NANOG versus Tubulin and the graphs represent the alteration in relation to the CD44−/CD133− cells (protein of interest/Tubulin equal to 1). Data are presented as the means ± SEM (n = 3, each group), *P < 0.05 vs. CD133−/CD44− group, #P < 0.05 vs. CD133−/CD44+ group, △P < 0.05 vs. CD133+/CD44− group. H Effect of UPF1 overexpression or knockdown on SOX2, OCT4, and NANOG expression assessed using western blotting. The results are presented as the ratio of the integrated density values of UPF1, SOX2, OCT4, and NANOG versus Tubulin. The graphs represent the alteration in the oe-UPF1 group and the sh-UPF1 group relative to their respective control groups (protein of interest/Tubulin equal to 1). Data are presented as the means ± SEM, *P < 0.05 vs. oe-NC group, #P < 0.05 vs. sh-NC group.

