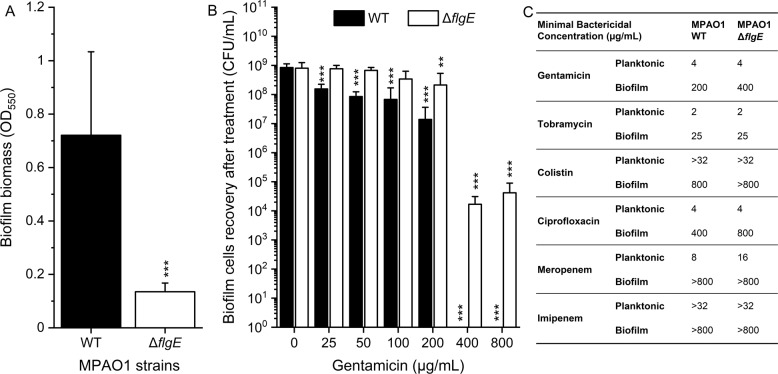
Fig. 2. Biofilm formation, biofilm tolerance, and planktonic resistance of MPAO1 ΔflgE towards different antibiotics.
A The biomass of the 24 h-old biofilms of P. aeruginosa MPAO1 WT and ΔflgE grown in M9 medium in 96-well plates was quantified by crystal violet. Results represent the mean ± SD of three biological repeats with eight technical repeats each. Student’s t-tests were performed with *** equals to P < 0.001. B Twenty-four hours-old biofilms were exposed to M9 medium supplemented with a gradient of gentamicin concentrations for 24 h and CFUs were counted after 24 h recovery in antibiotic-free M9 medium. Results represent the mean ± SD of three biological repeats with two technical repeats each. Student’s t-tests were performed in comparison to the untreated strain population with **P < 0.01 and ***P < 0.001. C The resistance profile of MPAO1 ΔflgE was measured by quantifying the minimal bactericidal concentrations of various antibiotics towards planktonic and biofilm cells population. The MBC-P and MBC-B are defined as the lowest concentration of a drug resulting in at least 3-log reduction of a planktonic and biofilm population, respectively. The MBC-P were measured by spotting a planktonic population on BHI agar after 24 h treatment and the MBC-B by spotting the biofilm suspension after 24 h treatment and 24 h recovery (three biological repeats with two technical repeats each, where the most representative maximal values are shown).

