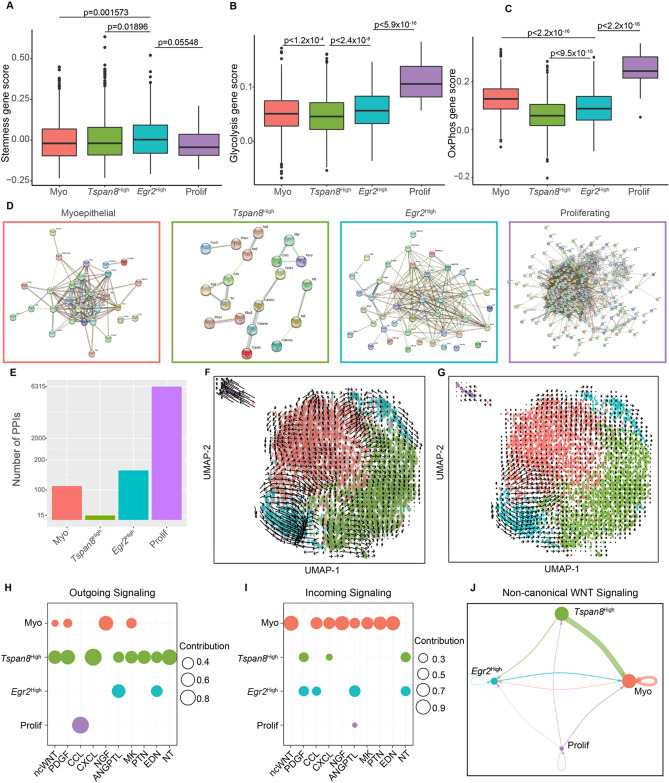
Figure 2.
Molecular features of the basal transcriptional states. (A–C) Boxplots displaying gene scoring of each basal transcriptional state using gene signatures for mammary stemness (A), glycolysis (B), and OxPhos (C). p values in (A-C) were generated using Mann–Whitney U tests. (D) PPIs for each cell state (myoepithelial, pink; Tspan8High, green; Egr2High, blue; proliferating, purple), where each node is protein coded by the marker gene and each edge is a predicted direct or indirect interaction. (E) Bar plots displaying the number of PPIs for each transcriptional state. (F–G) Projections of RNA Velocity fields onto UMAP from Fig. 1B using linear (F) and non-linear (G) models. (H–I) Dot plots indicating the outgoing (H) and incoming (I) signaling contributions from each transcriptional state for significant signaling pathways identified. (J) Signaling pattern of non-canonical WNT signaling.

