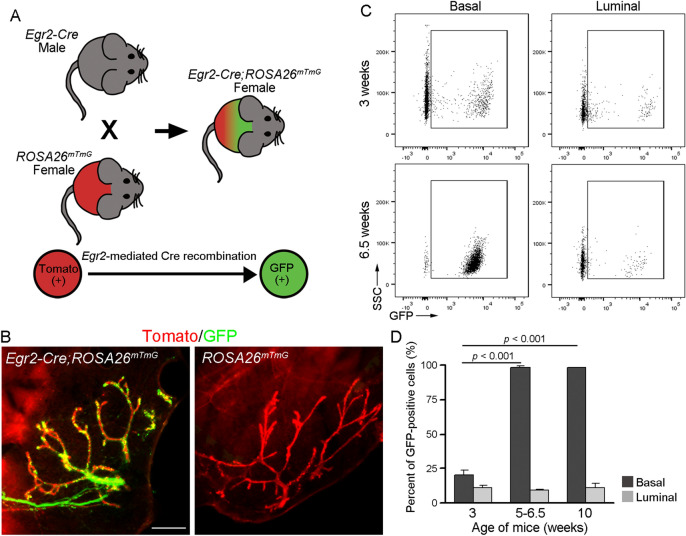
Figure 5.
Genetic labeling of Egr2-expressing cells and progenies in mammary gland. (A) Experimental design. (B) Whole-mount imaging of GFP and tdTomato fluorescence in mammary gland from 3-week-old Egr2-Cre;ROSA26mTmG or ROSA26mTmG mice. Scale bar = 500 μm. (C, D) Representative flow profiles (C) and summary bar plots (D) displaying the number of GFP-positive cells in basal and luminal cells during pubertal mammary development. p value was generated using a Student’s t-test. n = 3 Egr2-Cre;ROSA26mTmG mice per age analyzed.

