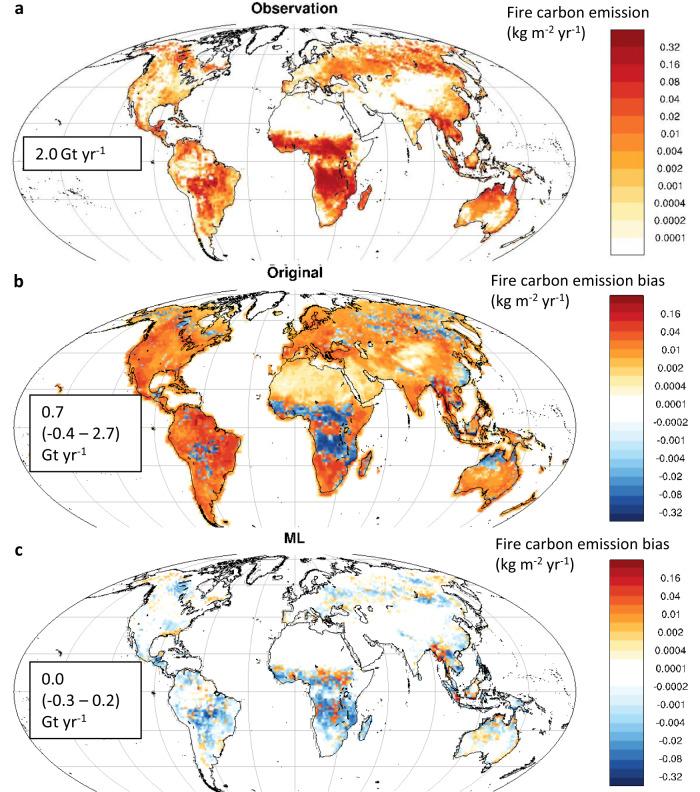
Fig. 1. Historical fire carbon emissions during 2007–2016 simulated by 13 Earth system models (ESMs) without and with the observational constraint.
a Observed mean fire carbon emissions (kg m−2 yr−1), averaged across two observational data sets. The global total fire carbon emission and its uncertainty range is marked. b Spatial distribution of the bias in original, unconstrained multimodel mean fire carbon emissions (kg m−2 yr−1). c Spatial distribution of the bias in observation-constrained multimodel, multi–data set mean fire carbon emissions (kg m−2 yr−1). The bias of global total fire carbon emission and its uncertainty range (10th–90th percentiles) is marked in the corresponding panels b, c.

