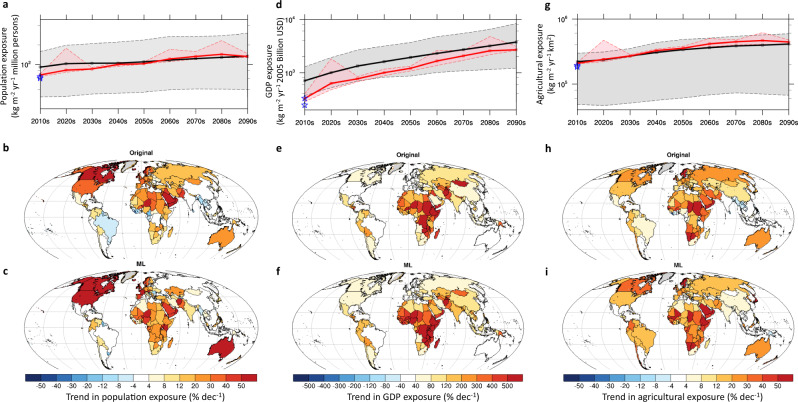
Fig. 4. Global and national evolution of socioeconomic risks from wildfire carbon emission during the 2010s to 2090 s.
a Original (black line with gray shading) and observation-constrained (red line with pink shading) time series of global total exposure to fire carbon emission in a. population (kg m−2 yr−1 million person), d gross domestic product (GDP) (kg m−2 purchasing power parity 2005 billion USD y−1), and g agricultural area (kg m−2 km2 y−1). The blue stars indicate the observed exposure to fire carbon emission in population, GDP, and agricultural area, respectively, during the 2010s. The lines represent the multimodel ensemble mean. The shadings represent the 10th and 90th percentiles among ensemble members. b, e, h original and c, f, i observation-constrained ensemble mean, national trend in the socioeconomic exposure to fire carbon emission in b and c population, e and f GDP, and h and i agricultural area. The trend is presented by the ratio between the projected trend and the exposure during the 2010s (% decade−1), indicated by either the b, e, h original or c, f, i observation-constrained ensemble.

