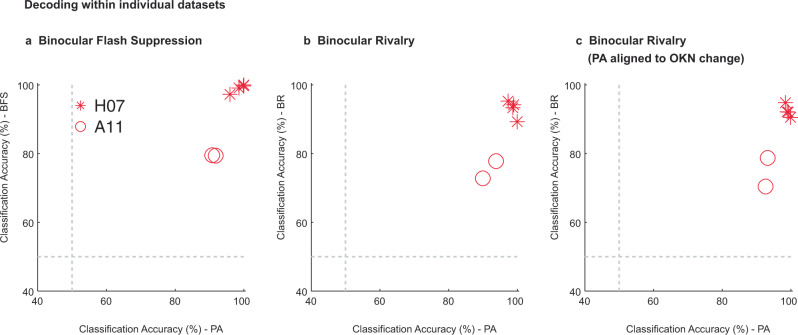
Fig. 4. Assessment of decoding within individual datasets.
This figure displays the classification accuracy at the level of individual recording sessions performed across the two animals: four sessions of H07 (red asterisks) and two sessions for A11 (red circles). Each point in the scatter plot corresponds to classification accuracy during PA or BR trials, obtained in a given dataset. The three panels present the results obtained across the different temporal phases of the paradigm: a, flash dominance, b, rivalry dominance, wherein PA trials are aligned to the physical stimulus change and c, rivalry dominance, wherein PA trials were aligned to the change in OKN. The results are computed over an 800 ms window starting 200 ms after the event used for aligning the data (physical stimulus change, or OKN derived change). We note that the classification accuracy for BR in b and c are similar but not identical, because they were obtained using two separate runs of the decoding analysis. In general, we observed strong classification accuracy even at the level of individual datasets.

