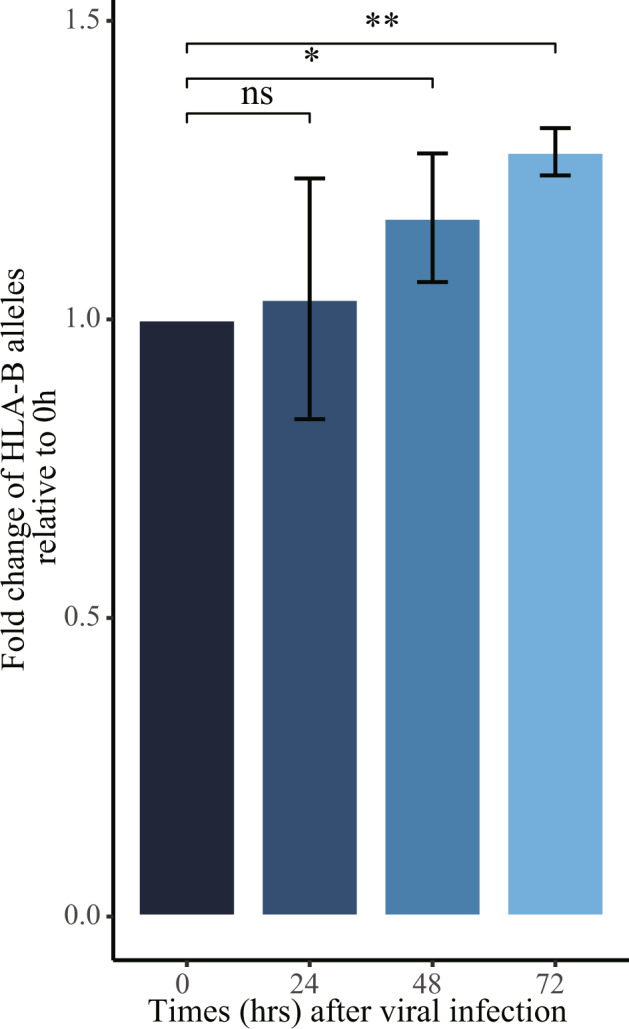
Fig. 4. Validation of the association of HLA-B allelic expression with SARS-CoV-2 infection in A549 cells assayed by allelic quantitative RT-PCR.

Barplot showing the time course of allelic fold changes of HLA-B two alleles relative to the starting time point. For the allelic qPCR assay, we conducted at least two independent viral infection experiments, where one representative experiment with triplicate is shown. *P < 0.05, **P < 0.01, compared with control cells.
