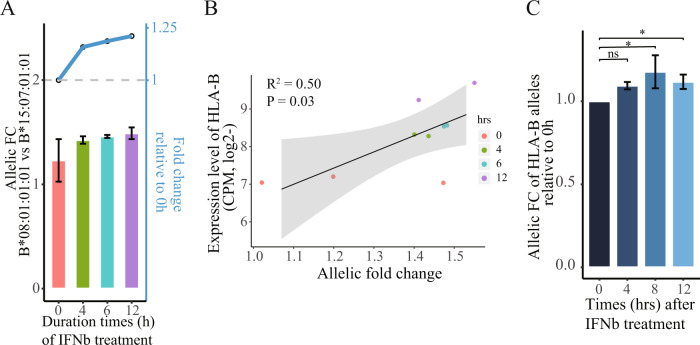
Fig. 6. Increased AE patterns between HLA-B alleles under IFNβ treatment condition in human lung cells.
(A) Barplot showing the time course of allelic FCs of HLA-B two alleles in a time-course way. Dotted line plots shown in the upper parts correspond to fold changes (y-axis on the right) that are normalized to the time point on treatment initiation. The p value is unavailable due to only two biological replicates for each time point. (B) Correlation of HLA-B expression levels (y-axis) with allelic FC between HLA-B two alleles (x-axis) for the IFNβ treatment and untreated conditions in NHBE cells. P value is based on the Pearson’s correlation test. (C) Barplot showing the time course of allelic fold changes of HLA-B two alleles relative to the time point on treatment initiation. For the allelic qPCR assay, we conducted at least two independent viral infection experiments, where one representative experiment with triplicate is shown. *P < 0.05, compared with controls.

