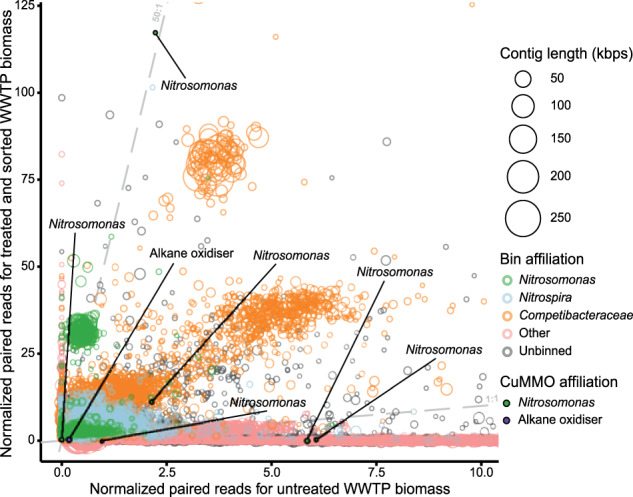
Fig. 8. Differential coverage plot showing the abundance of contigs in the municipal WWTP untreated activated sludge sample in comparison to the activity-based labeled and sorted sample.

Contig abundances were calculated by normalizing paired read counts by gene length and million reads mapped to the assembly. Each circle represents an assembled contig ≥1500 bps, indicated by circle size. Contigs assigned to the automated bins of taxa of interest are highlighted using specific colors. Contigs with genes encoding members of the CuMMO protein family are emphasized with fill circles and text. For added clarity, dashed lines were drawn with a slope of 1 and 50 to guide estimations of the differences in normalized abundances between the samples. The plot is zoomed in on the region containing >80% of all data, the full version is provided as Supplementary Fig. S6.
