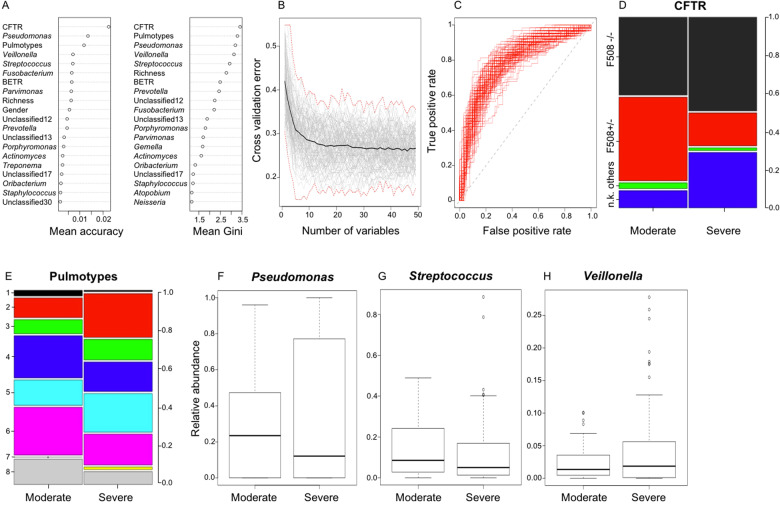
Fig. 4. Predictors of disease aggressiveness (moderate vs severe) at young age (10–21 years).
A Random forest variable importance plot showing predictors ranked by the mean decrease in accuracy and Gini index. The average of 1000 patient-stratified models is shown. B Cross-validation plot depicting average cross-validation error (black) as function of variable numbers. A total of 100 patient-stratified models using 10-fold cross-validation (gray), as well as maximum and minimum errors (red, dashed line) are depicted. C Receiver operator curve of 100 patient-stratified full models, mean AUC = 0.79. D, E Proportion of CFTR genotypes and pulmotypes in mild and moderate disease, corresponding categories color-coded (F508–/– = F508del homozygous; F508+/– = F508del heterozygous; others = no F508del allele; u.k = unknown CFTR genotype). F–H Box plots showing the distribution of Pseudomonas, Streptococcus, and Veillonella relative abundances in moderate and severe disease phenotypes at young age.

