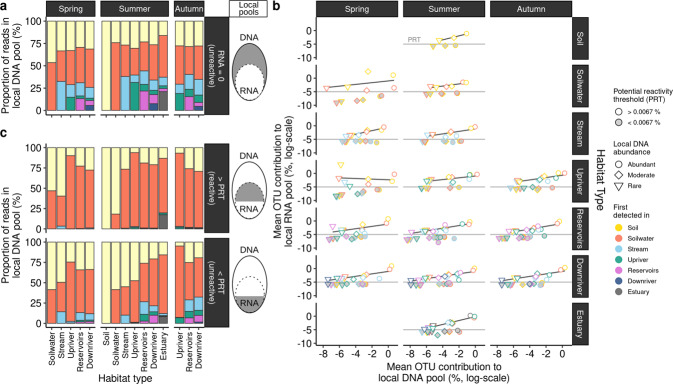
Fig. 5. Taxa along the whole rank abundance curve contribute to the reactive pool.
a Contribution of taxa (operational taxonomic units (OTUs)) detected in DNA without any RNA observation (RNA = 0) to the local number of DNA reads for each habitat type and season. OTUs were binned by (1) their first detected habitat in DNA along the continuum, (2) local DNA abundance (e.g. abundant, moderate, rare, see methods). b Each panel corresponds to an individual OTU’s reads contribution to the local DNA and RNA pool, which was defined for each season and habitat type. Taxa were classified and averaged by (1) first detected habitat and (2) local DNA abundance and lastly, (3) by whether they are above or below the identified potential reactivity threshold (PRT) of 0.0067% RNA contribution to the total local RNA pool. Linear regression slopes were plotted for the averaged OTU contributions above the PRT. Due to the absence of a linear relationship of OTUs < PRT, OTUs > PRT were interpreted to be reactive, while OTUs < PRT were considered unreactive. c Based on the observations of (b) and the consequent classification of reactive (upper panel) and reactive (lower panel) taxa, individual OTU’s contribution to the total local DNA pool were visualized. Values are expressed as a fraction of the total number of DNA reads for each habitat type and season.

